The value of a company’s shares of stock often moves significantly with information about earnings. Why begin a discussion of inventory with this observation? The reason is that inventory measurement bears directly on the determination of income! The slightest adjustment to inventory will cause a corresponding change in an entity’s reported income.
Recall from earlier chapters this basic formulation:
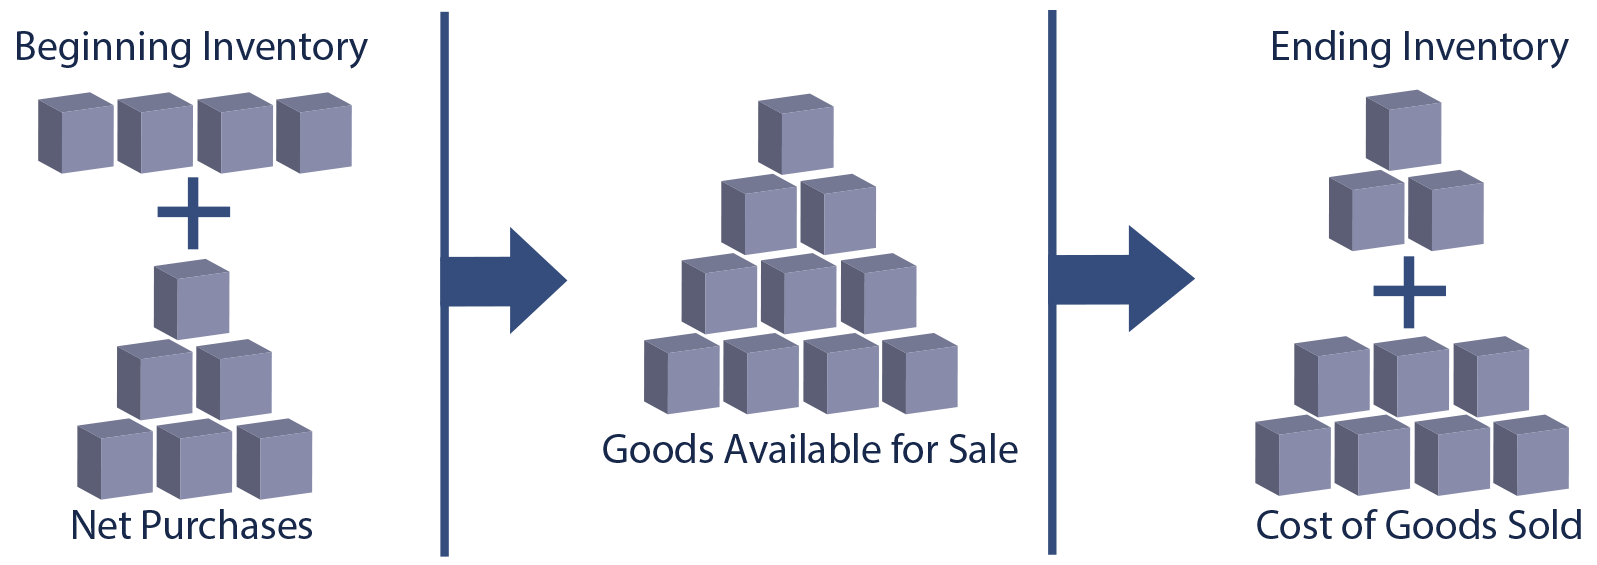
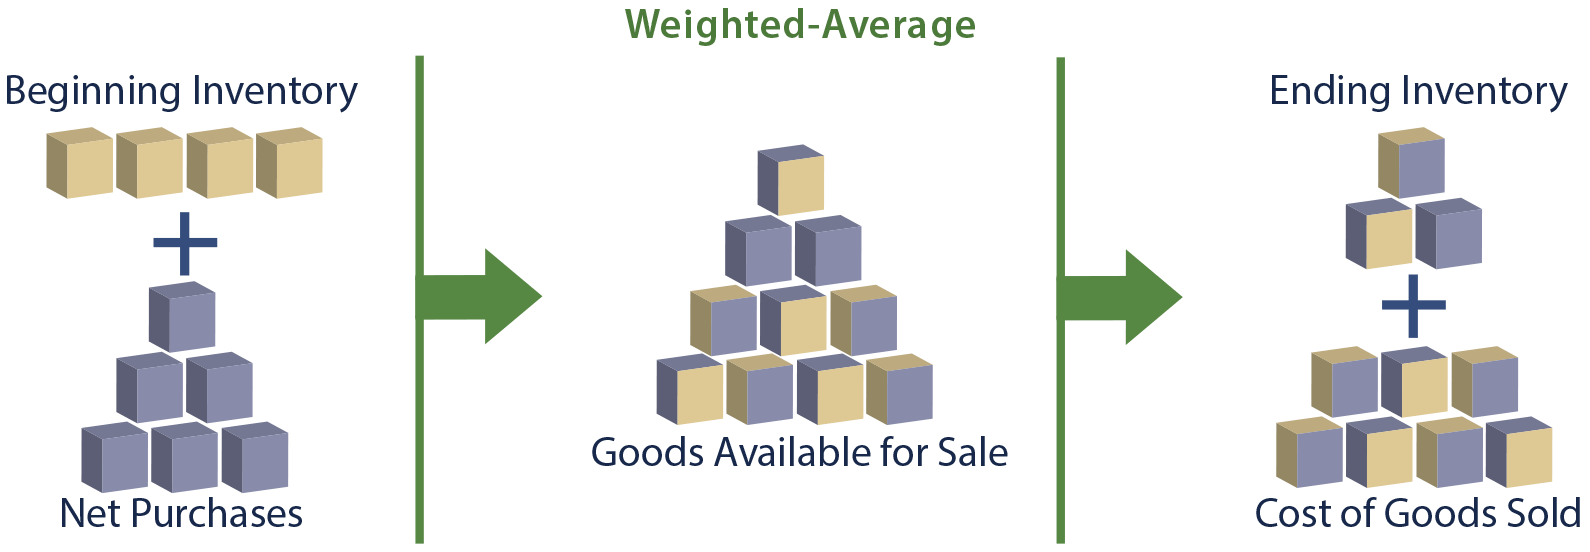
Notice that the goods available for sale are “allocated” to ending inventory and cost of goods sold. In the graphic, the inventory appears as physical units. But, in a company’s accounting records, this flow must be translated into units of money. The following graphic illustrates this allocation process.
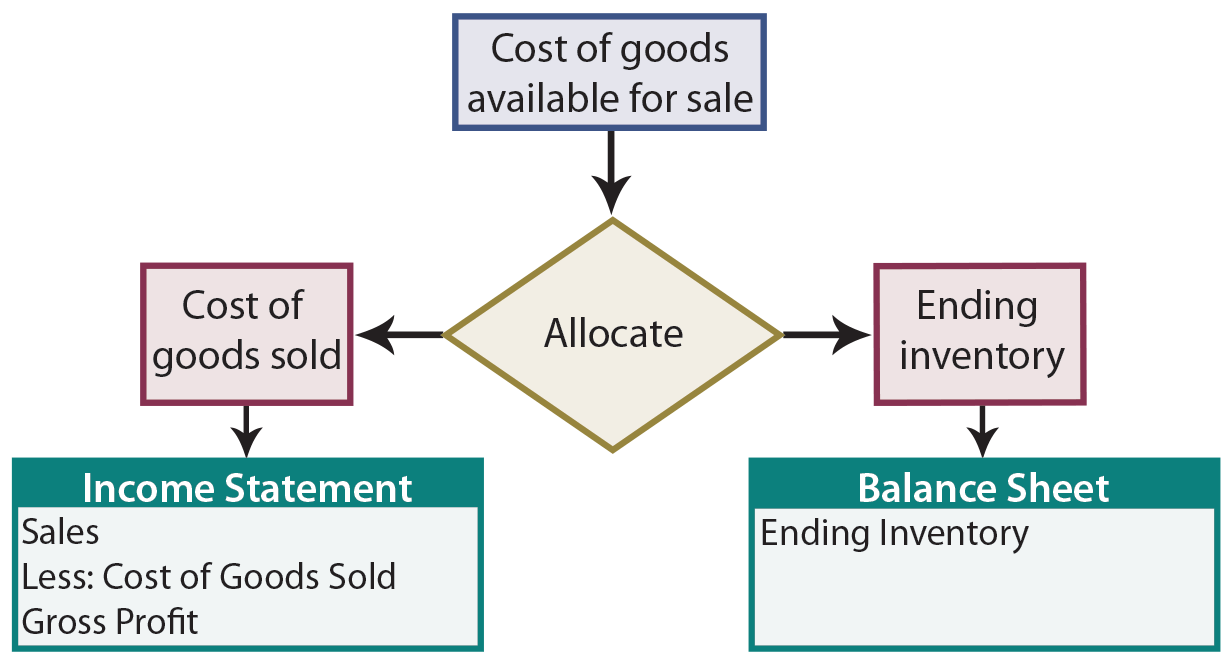
Observe that if $1 less is allocated to ending inventory, then $1 more flows into cost of goods sold (and vice versa). Further, as cost of goods sold is increased or decreased, there is an opposite effect on gross profit. Thus, a critical factor in determining income is the allocation of the cost of goods available for sale between ending inventory and cost of goods sold:

The Cost of Ending Inventory
In earlier chapters, the assigned cost of inventory was always given. Not much was said about how that cost was determined. To now delve deeper, consider a general rule: Inventory should include all costs that are “ordinary and necessary” to put the goods “in place” and “in condition” for resale.
This means that inventory cost would include the invoice price, freight-in, and similar items relating to the general rule. Conversely, “carrying costs” like interest charges (if money was borrowed to buy the inventory), storage costs, and insurance on goods held awaiting sale would not be included in inventory accounts; instead those costs would be expensed as incurred. Likewise, freight-out and sales commissions would be expensed as a selling cost rather than being included with inventory.
Costing Methods
Once the unit cost of inventory is determined via the preceding logic, specific costing methods must be adopted. In other words, each unit of inventory will not have the exact same cost, and an assumption must be implemented to maintain a systematic approach to assigning costs to units on hand (and to units sold).
To solidify this point, consider a simple example. Mueller Hardware has a nail storage barrel. The barrel was filled three times. The first filling consisted of 100 pounds costing $1.01 per pound. The second filling consisted of 80 pounds costing $1.10 per pound. The final restocking was 90 pounds at $1.30 per pound. The barrel was never allowed to empty completely and customers have picked all around in the barrel as they bought nails. It is hard to say exactly which nails are “physically” still in the barrel. As one might expect, some of the nails are probably from the first filling, some from the second, and some from the final. At the end of the accounting period, Mueller weighs the barrel and decides that 120 pounds of nails are on hand. What is the cost of the ending inventory? Remember, this question bears directly on the determination of income!
To deal with this very common accounting question, a company must adopt an inventory costing method (and that method must be applied consistently from year to year). The methods from which to choose are varied, generally consisting of one of the following:
- First-in, first-out (FIFO)
- Last-in, first-out (LIFO)
- Weighted-average
Each of these methods entails certain cost-flow assumptions. Importantly, the assumptions bear no relation to the physical flow of goods; they are merely used to assign costs to inventory units. (Note: FIFO and LIFO are pronounced with a long “i” and long “o” vowel sound.) Another method that will be discussed shortly is the specific identification method. As its name suggests, the specific identification method does not depend on a cost flow assumption.
First-In, First-Out Calculations
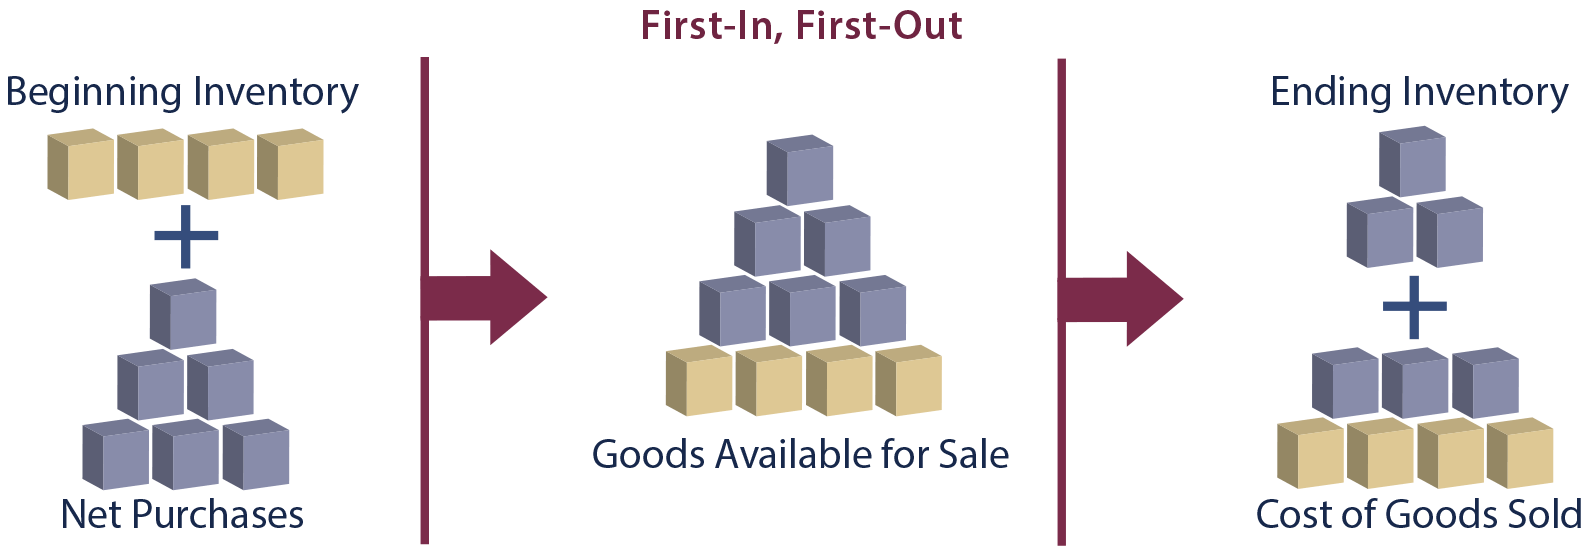
With first-in, first-out, the oldest cost (i.e., the first in) is matched against revenue and assigned to cost of goods sold. Conversely, the most recent purchases are assigned to units in ending inventory. For Mueller’s nails, the FIFO calculations would look like this:

Last-In, First-Out Calculations
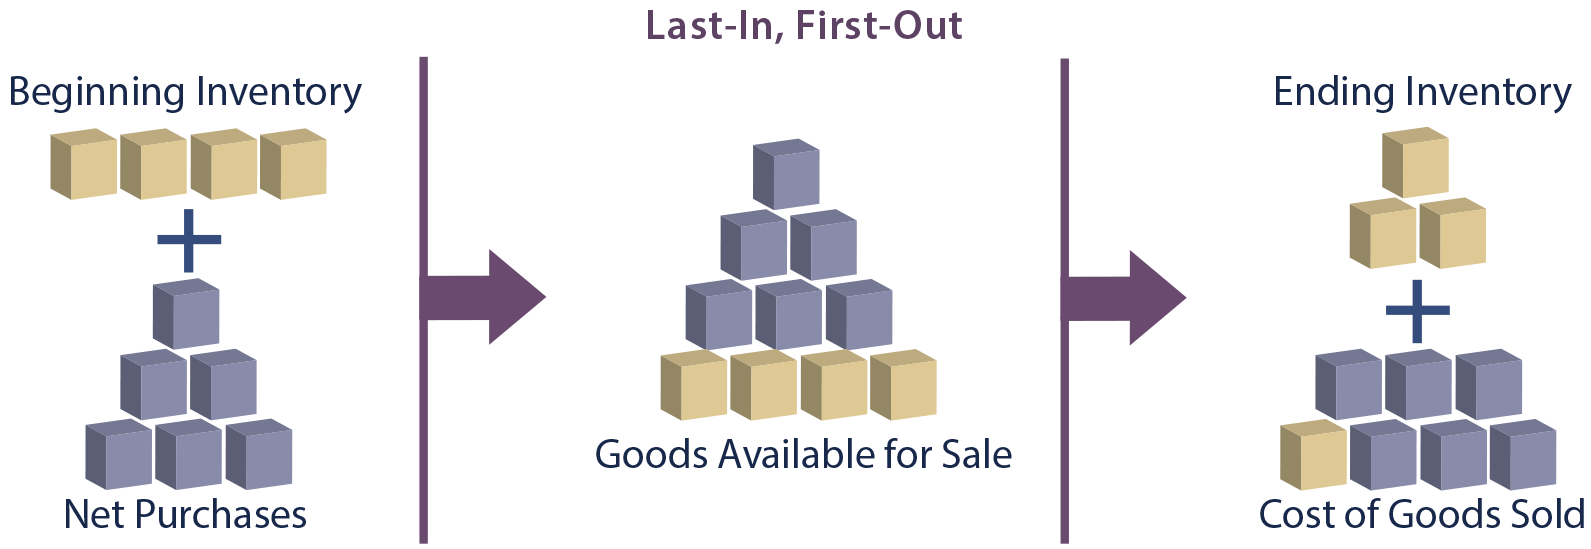
Last-in, first-out is just the reverse of FIFO; recent costs are assigned to goods sold while the oldest costs remain in inventory:

Weighted Average
The weighted-average method relies on average unit cost to calculate cost of units sold and ending inventory. Average cost is determined by dividing total cost of goods available for sale by total units available for sale. Mueller Hardware paid $306 for 270 pounds, producing an average cost of $1.13333 per pound ($306/270). The ending inventory consisted of 120 pounds, or $136 (120 X $1.13333 average price per pound). The cost of goods sold was $170 (150 pounds X $1.13333 average price per pound):

The Impact of Beginning Inventory
Examine each of the following comparative illustrations noting how the cost of beginning inventory and purchases flow to ending inventory and cost of goods sold.
Detailed Example
Accountants usually adopt the FIFO, LIFO, or Weighted-Average cost flow assumption. The actual physical flow of the inventory may or may not bear a resemblance to the adopted cost flow assumption. In the following illustration, assume that Gonzales Chemical Company had a beginning inventory balance that consisted of 4,000 units costing $12 per unit. Purchases and sales are shown in the schedule. Assume that Gonzales conducted a physical count of inventory and confirmed that 5,000 units were actually on hand at the end of the year.

Based on the information in the schedule, Gonzales will report sales of $304,000. This amount is the result of selling 7,000 units at $22 ($154,000) and 6,000 units at $25 ($150,000). The dollar amount of sales will be reported in the income statement, along with cost of goods sold and gross profit. How much is cost of goods sold and gross profit? The answer will depend on the cost flow assumption.
FIFO
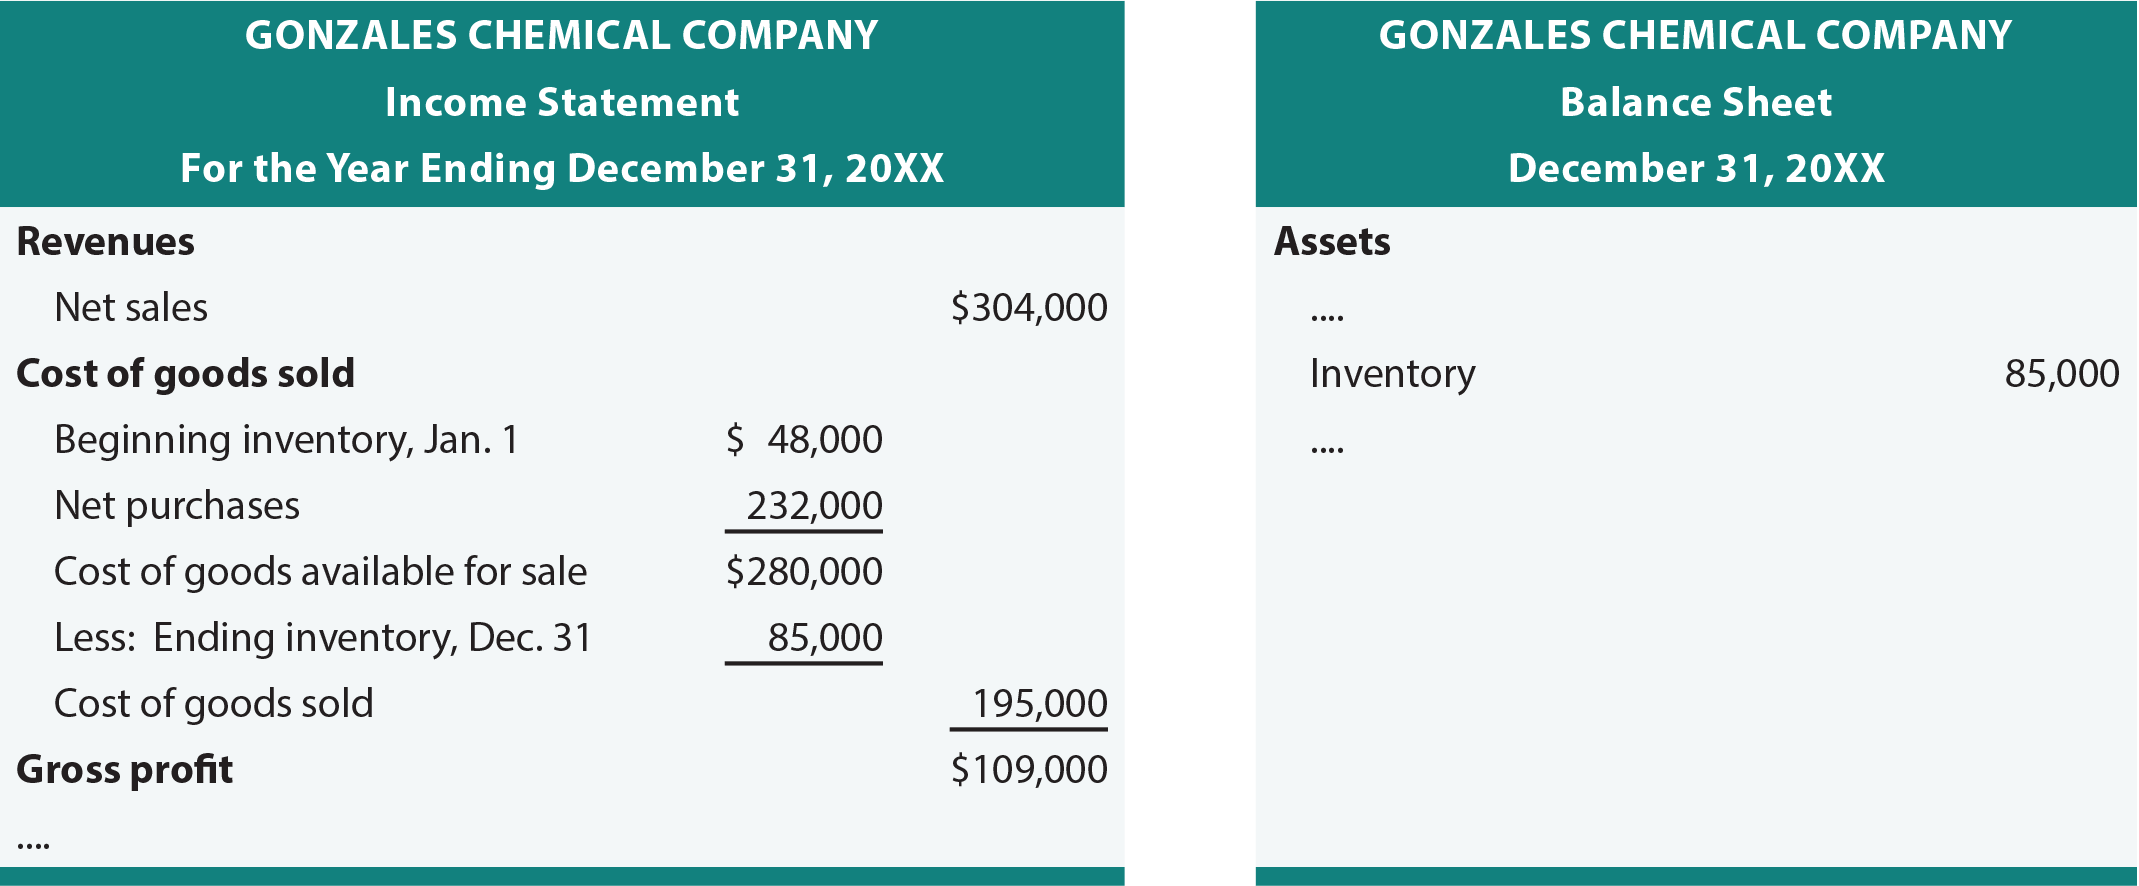
If Gonzales uses FIFO, ending inventory, cost of goods sold, and the resulting financial statements are as follows:

LIFO
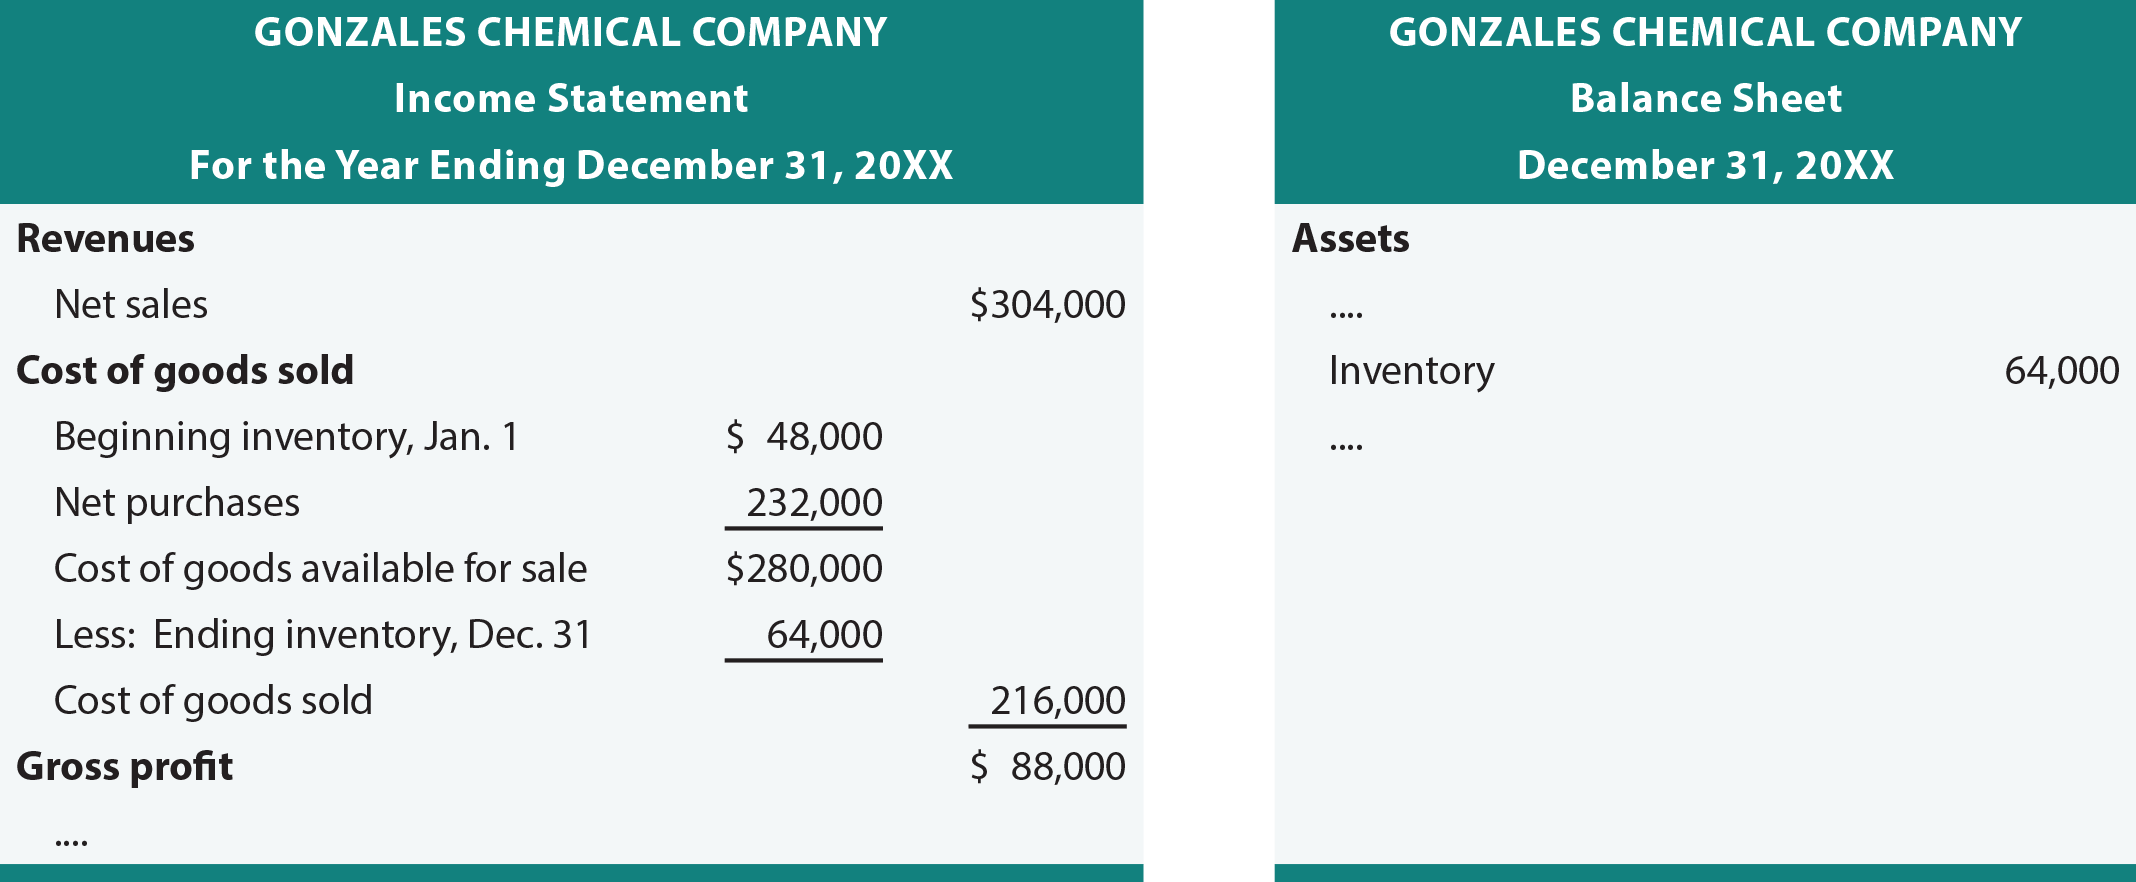
If Gonzales uses LIFO, ending inventory, cost of goods sold, and the resulting financial statements are as follows:

Weighted Average
If Gonzales uses the weighted-average method, ending inventory and cost of goods sold calculations are as follows:

These calculations support the following financial statement components.

Comparing Methods
The following table reveals that the amount of gross profit and ending inventory can appear quite different, depending on the inventory method selected:

The preceding results are consistent with a general rule that LIFO produces the lowest income (assuming rising prices, as was evident in the Gonzales example), FIFO the highest, and weighted average an amount in between. Because LIFO tends to depress profits, one may wonder why a company would select this option; the answer is sometimes driven by income tax considerations. Lower income produces a lower tax bill, thus companies will tend to prefer the LIFO choice. Usually, financial accounting methods do not have to conform to methods chosen for tax purposes. However, in the U.S., LIFO “conformity rules” generally require that LIFO be used for financial reporting if it is used for tax purposes. In many countries LIFO is not permitted for tax or accounting purposes, and there is discussion about the U.S. perhaps adopting this global approach.
Accounting theorists may argue that financial statement presentations are enhanced by LIFO because it matches recently incurred costs with the recently generated revenues. Others maintain that FIFO is better because recent costs are reported in inventory on the balance sheet. Whichever method is used, it is important to note that the inventory method must be clearly communicated in the financial statements and related notes. LIFO companies frequently augment their reports with supplemental data about what inventory cost would be if FIFO were used instead. Consistency in method of application should be maintained. This does not mean that changes cannot occur; however, changes should only be made if financial reporting is deemed to be improved.
Specific Id
The specific identification method requires a business to identify each unit of merchandise with the unit’s cost and retain that identification until the inventory is sold. Once a specific inventory item is sold, the cost of the unit is assigned to cost of goods sold. Specific identification requires tedious record keeping and is typically only used for inventories of uniquely identifiable goods that have a fairly high per-unit cost (e.g., automobiles, fine jewelry, and so forth).
To illustrate, assume Classic Cars began the year with 5 units in stock. Classic has a detailed list, by serial number, of each car and its cost. The aggregate cost of the cars is $125,000. During the year, 100 additional cars are acquired at an aggregate cost of $3,000,000. Each car is unique and had a different unit cost. The year ended with only 3 cars in inventory. Under specific identification, it would be necessary to examine the 3 cars, determine their serial numbers, and find the exact cost for each of those units. If that aggregated to $225,000, then ending inventory would be reported at that amount. One may further assume that the cost of the units sold is $2,900,000, which can be calculated as cost of goods available for sale minus ending inventory. The cost of goods sold could be verified by summing up the individual cost for each unit sold.
Need help preparing for an exam?
Check out ExamCram the exam preparation tool!
| Did you learn? |
|---|
| Understand cost of goods available for sale, and how this cost must be allocated to inventory and cost of goods sold. |
| Be able to apply inventory costing methods such as FIFO, LIFO, weighted average, and specific identification. |
| Distinguish between the physical flow of goods and their cost flow for accounting purposes. |
| Know the general impacts of alternative cost flow assumptions, with special attention to the tax and financial statement results. |
| Must inventory methods be used consistently? |
