Many companies have expressed frustration with arbitrary allocations associated with traditional costing methods. This has led to increased utilization of a uniquely different approach called activity-based costing (ABC). A simplified explanation of ABC is that it divides production into core activities, defines costs for those activities, and allocates those costs to products based on consumption of the activities.
 Consider that traditional costing methods divide costs into product costs and period costs. The period costs include selling, general, and administrative items that are charged against income in the period incurred. Product costs are the familiar direct materials, direct labor, and factory overhead. These costs are traced/allocated to production under both job and process costing techniques. However, some managers reject this methodology as conceptually flawed. It can be argued that a finished product should include not only the cost of direct materials, but also a portion of the administrative cost necessary to buy the materials (e.g., many companies have a separate unit in charge of purchasing). Conversely, the cost of a plant security guard is part of factory overhead, but some managers fail to see a correlation between that activity and a finished product; after all, the guard will be needed no matter how many units are produced.
Benefits Of ABC
Activity-based costing attempts to overcome the perceived deficiencies in traditional costing methods by more closely aligning activities with products. This requires abandoning the traditional division between product and period costs, instead seeking to find a more direct linkage between activities, costs, and products. This means that products will be charged with the costs of manufacturing and nonmanufacturing activities. It also means that some manufacturing costs will not be attached to products. This is quite a departure from traditional thought.
With ABC a product is only charged with the cost of capacity utilized. Idle capacity is isolated and not charged to a product or service. Under traditional approaches, some idle capacity may be incorporated into the overhead allocation rates, thereby potentially distorting the cost of specific output. This may limit the ability of managers to truly understand and identify the best business decisions about product pricing and targeted production levels.
Limiting Factors
 One limitation of ABC is that external reporting must be based on traditional absorption costing methods. Absorption costing requires the traditional division between product costs and period costs, with inventory absorbing all of the manufacturing costs and none of the period costs. As a result, ABC may produce results that differ from those required under generally accepted accounting principles (GAAP). Therefore, ABC is usually viewed as supplemental in nature. It is used for internal management decision making, but it may not be suitable for public reporting if results differ materially from absorption methods.
The fact that ABC is not GAAP usually means that a company that wishes to benefit from ABC must develop one costing system for external reporting and another for internal management. Another disadvantage of ABC is that it is usually more involved than other approaches. Rather than applying all factory overhead on some simple basis such as labor hours, it requires the development of numerous cost pools that must be individually allocated.
Catalyst For ABC
 For a single-product company with fairly stable inventory levels, traditional and ABC methods will yield about the same results. But, for multi-product/service firms, the arbitrary allocation of costs can pretty much “make or break” the perceived profitability of each product or service. As companies have grown larger and more diverse in output, there has been an accompanying concern about how costing occurs. Arguably, product diversification has been a major contributing factor to the management accountant’s pursuit of alternative costing methods like ABC.
Another driver of ABC-type approaches has been the advent of computer technology. Before modern information systems, it was very expensive to manipulate data. Most firms were necessarily content to live with simple approaches that allocated factory overhead on a single basis. The ease with which data can be managed under a sophisticated information system greatly reduces the cost, and error rate, associated with ABC. It is not surprising that the method’s popularity is inversely related to data processing costs.
Recap
This chapter will close with a case study on ABC. The case will show how results can differ significantly under ABC versus traditional costing methods. The lesson is to move carefully in using cost information. It is important to fully consider many variables, some of which are not always apparent. Managerial accounting provides many tools to support decision making. ABC is one such tool. It enables a systematic review of activities that will help pinpoint opportunities for cost control and reallocation of capacity to higher yielding products. But, ABC is not perfect. In fact, ABC is no better than the process used to identify activities and cost allocations. These elements are ultimately based on human judgment.
A Closer Look At ABC Concepts
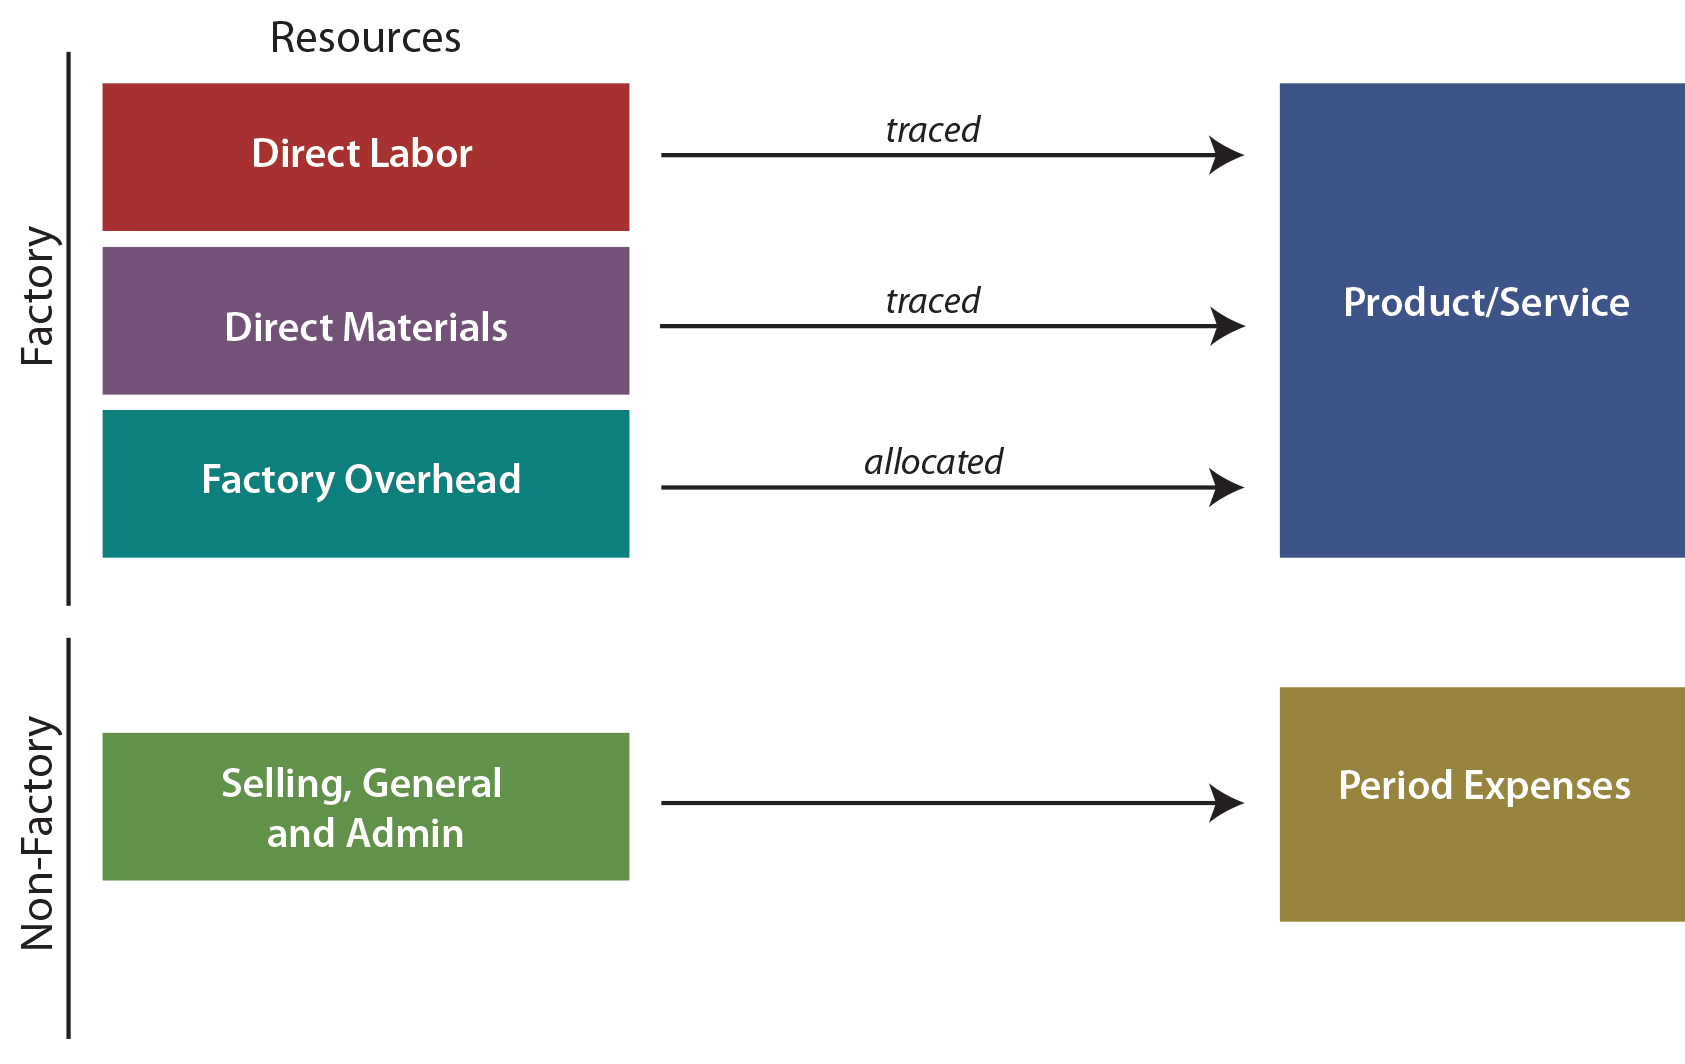
With traditional costing methods, prime costs are traced to output while factory overhead is allocated to output. Non-factory costs do not get assigned to a product:
Compare this traditional logic to ABC, and one sees a reversal of the thought process. With ABC, cost objects are broadened to include not only products/services, but also other objects like customers, markets, and so on. These “cost objects” are seen as consuming activities. The activity driver is the event that causes consumption of an activity. For instance, each customer may receive a catalog, whether he or she orders or not during a period. Preparation and distribution of the catalog is the “activity” that is being driven by the number of customers. Activities necessarily consume resources. Thus, preparation of a catalog will require labor, printing, office space, etc. Thus, activities drive the need for resources and are said to be resource drivers. The following graphic reveals the conceptual notion of ABC for two types of cost objects, which is quite different and much more involved than the traditional costing approaches. In reviewing the graphic, notice that costs that are directly traced to a cost object need not be “routed” through an activity:
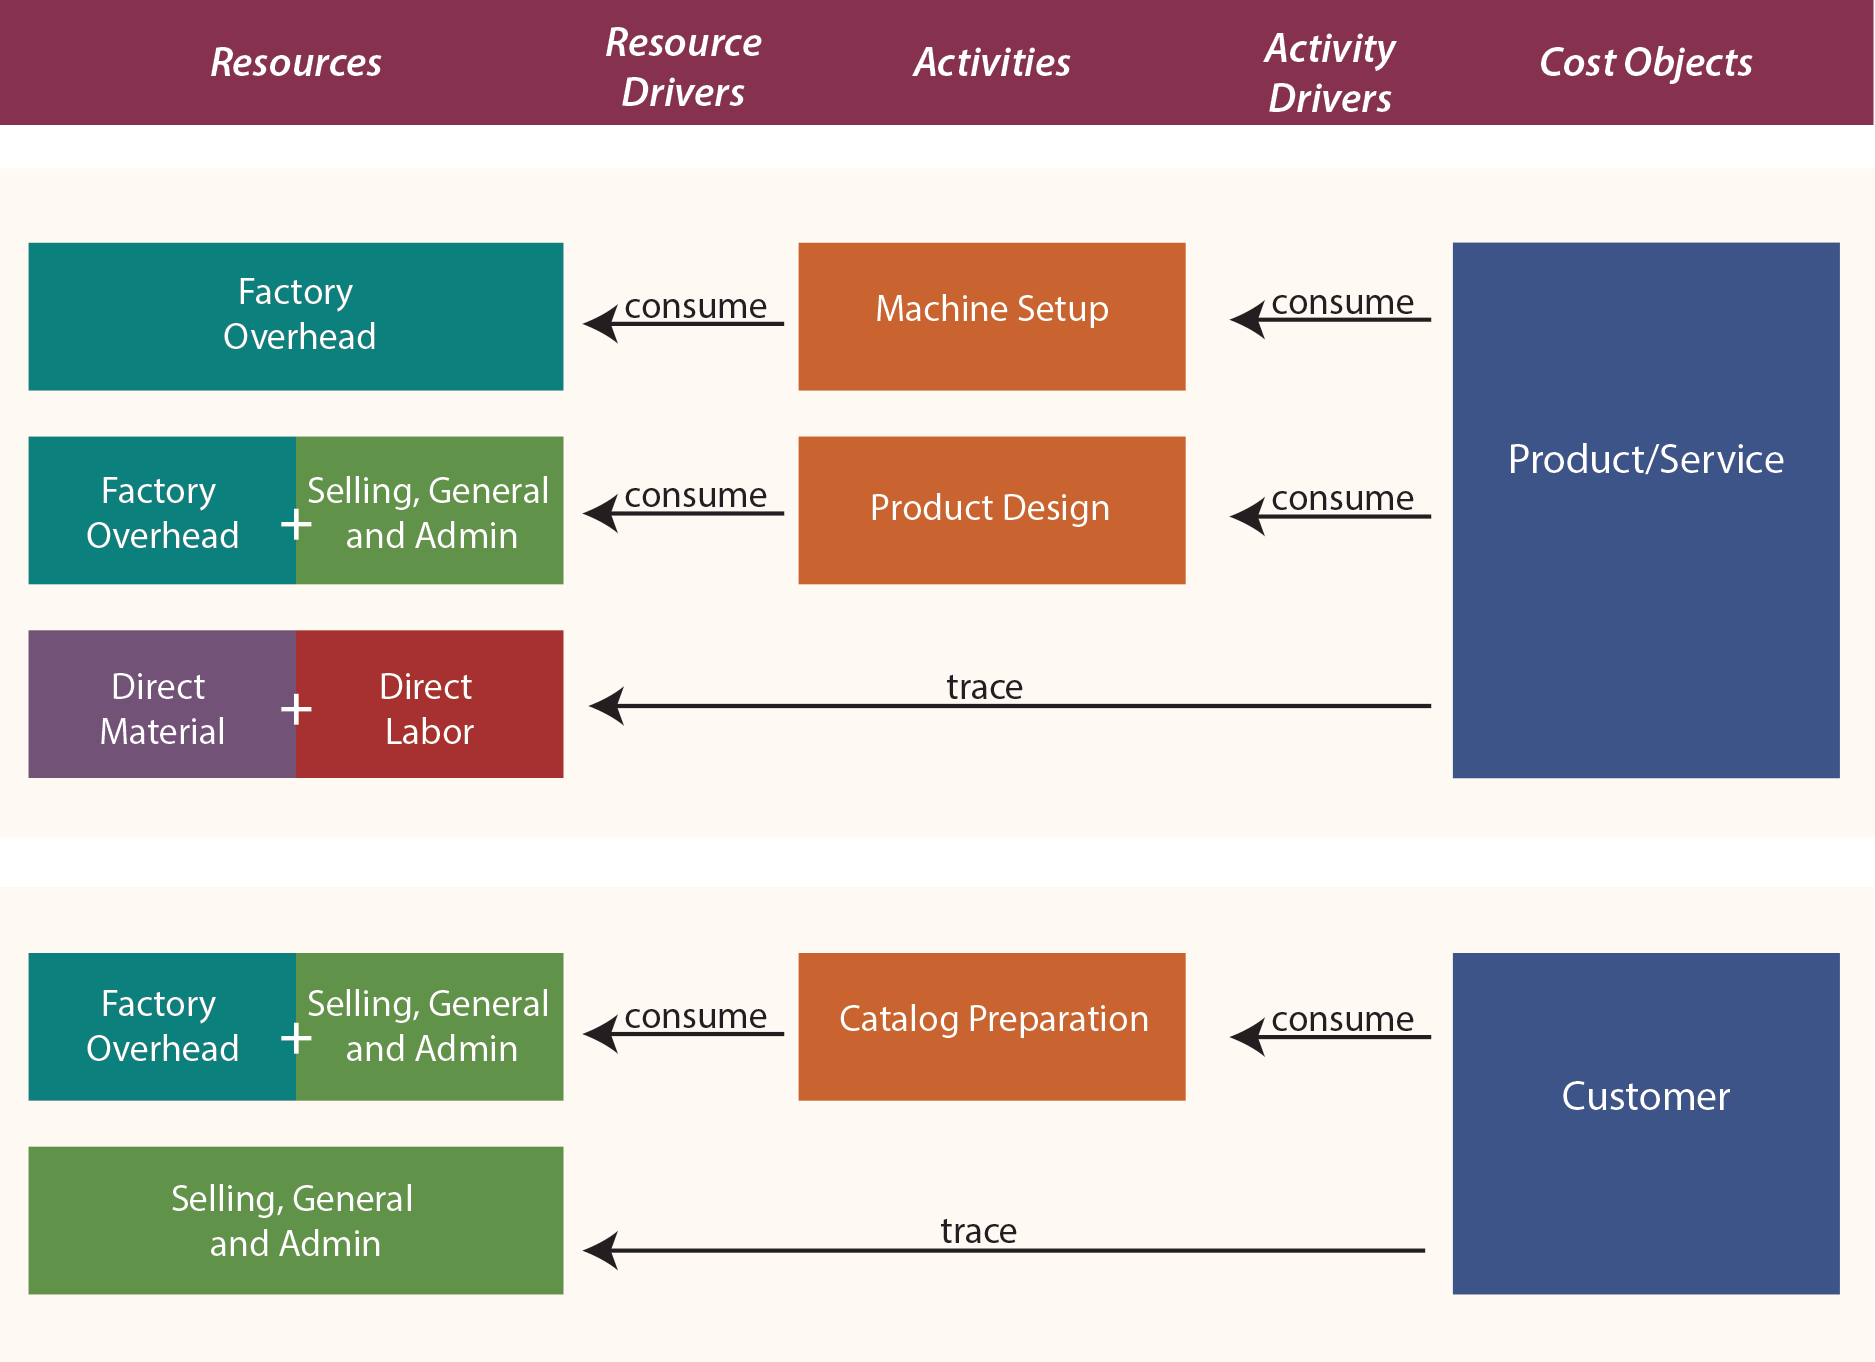
A business might have dozens of cost objects, hundreds of activities, and numerous resource pools to evaluate. A diagram of the interconnectivity can reveal multiple cost objects feeding off of many shared activities that in turn use up various resources.
The Steps To ABC
ABC requires several steps for a successful implementation:
- STUDY PROCESSES AND COSTS — The first step is a detailed study of all business processes and costs. This extensive study will usually involve employees from throughout the organization. Employee involvement is crucial for acceptance of the measures produced by the system. Employees need to believe the results of the accounting system before they will truly rely on the results.
- IDENTIFY ACTIVITIES — Once a business is understood, care should be used in selecting the business activities that will be central to the cost allocations. Too many activities and the system will become unmanageable; too few and the information will not be meaningful. It is helpful to think of activities at different levels:
 Unit-level activities are those activities that have a one-to-one correspondence with a unit of output. For example, a telescope manufacturer may have to perform some final calibration activity to each finished product. Thus, calibration may be seen as a unit-level activity.
- Batch-level activities are those activities that must be performed, but can relate to one or more units of output. In some cases, shipping can be seen as an excellent example of a batch process. Assume that Nile is an online bookstore. Some customers order only one book while others may order a dozen books at a time. In each case, the customer’s books must be packaged and shipped. Roughly the same activity is required independent of how many books are put in a box.
- Product-level activities are carried out at the product level, no matter the volume of production. Product design and marketing are activities that may have a one-to-one relation to the number of end products.
- Customer-level activities can take many forms. These include technical support help lines, catalogs, sales calls, and so on.
Other activity levels might be appropriate. Some businesses will identify market-level activities. For example, most global companies contract with an independent customs broker within each market served. Thus, the cost of customs brokerage services can be seen as a function of markets served. There are also entity-sustaining activities. For example, a public company in the USA must incur substantial costs to comply with Sarbanes-Oxley legislation. The preceding “levels” provide a frame of reference that is helpful in considering the important activities unique to an organization. As a general rule, a company would (1) develop a list of every conceivable activity, (2) segregate the activities according to level, and (3) look for logical ways to combine similar activities within each level.
 IDENTIFY TRACEABLE COSTS — Some costs can be traced directly to an end object. One example is the direct material and direct labor that goes into a product. But, there are other examples. The preparation of a product catalog can consume many hours of indirect labor and other internal resources that would be attributable to a related activity cost pool; but, it may also involve an outside printer/postage and that cost can be traced directly to the “customer” cost object.
- ASSIGN REMAINING COSTS TO ACTIVITIES — Remaining costs are assigned to activities. As an example, there may be a separate industrial engineering group that does nothing but machine setup prior to a production run. The cost of this group is easily assigned to the machine setup activity, which in turn will be reallocated to a variety of end products. However, the janitorial group may perform a major cleanup after each machine setup. Perhaps 10% of the janitorial staff’s time should be assigned to machine setup and the other 90% to general maintenance.
Some resources are consumed, and no one can agree as to the cost object that should absorb the resource. For example, what object should bear the cost of landscaping the corporate office? Suffice it to say that the cost allocation decisions can be contentious, and some costs may never find a logical home. Therefore, ABC may leave some costs as unallocated. Unallocated does not mean to “ignore.” While it may be perfectly logical to leave some costs as unallocated for purposes of identifying the cost of a specific product or other cost object, it would be foolhardy to forget about those costs in overall management of the organization.
 DETERMINE PER-ACTIVITY ALLOCATION RATES — Once costs for each activity have been determined, it is then necessary to unitize the cost pool. For example, if the catalog preparation activity cost pool contained $500,000 and 200,000 catalogs were produced, then the allocated catalog cost would be $2.50 each.
- APPLY COSTS TO OBJECTS — The final step is to utilize the activity-based rates in determining the amount of activity cost to allocate to each cost object. The allocated cost from the catalog preparation pool was $2.50 per unit. This is not the total cost; this is just the allocated amount. The total cost would also include the directly traceable amounts (printing, postage, etc.). This catalog cost, along with other customer-related costs, would be compiled in a summary report. Managers would then have a measure of how much it costs to support one additional customer. Similarly, measures would be produced for each additional cost object.
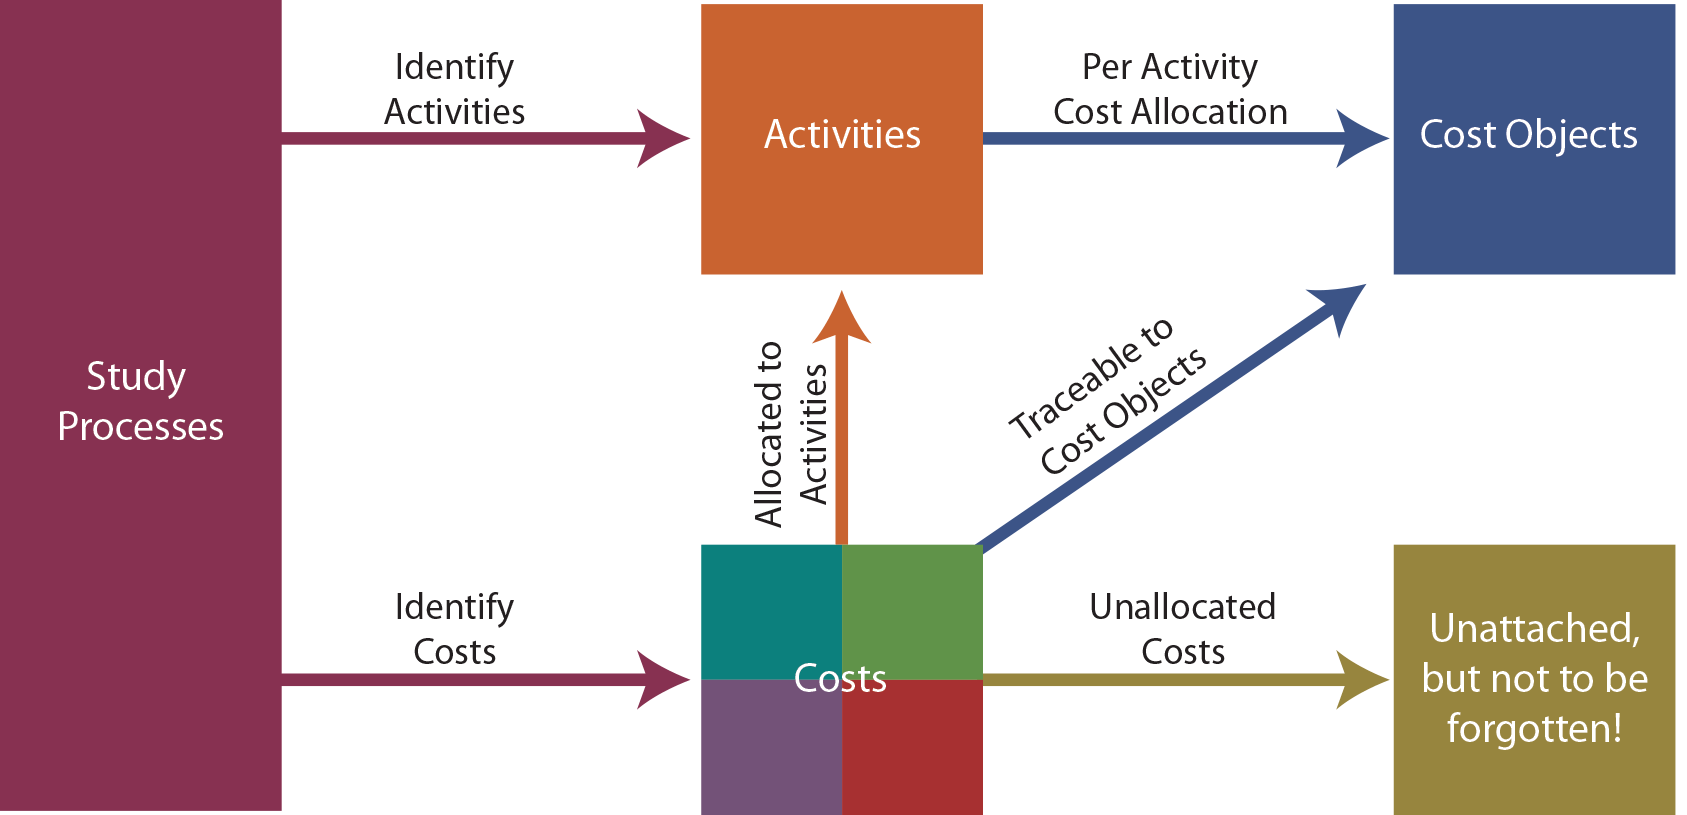
The objective of ABC is to derive improved measures of cost. By introducing activity cost pools, one is better able to allocate the costs (resources) to end objects (products, customers, etc.). The necessary steps to develop an ABC system are summarized as follows:
Case Study
David Eng enjoys listening to music while playing golf and formed the Golf and Music Enthusiast Company (GAME).
GAME developed two specialized products. The first product is GLASSESong, a pair of sunglasses with a built-in speaker. The other is CAPlayer, a golf cap with a built-in speaker. Both products connect wirelessly to a personal device.
GAME has been employing traditional costing methods and applies factory overhead on the basis of labor costs. The products sell as fast as they can be produced so there is virtually no inventory. For a recent period CAPlayer sold 90,000 units and GLASSESong sold 110,000 units. Each unit sells for $60 and total sales were $12,000,000 ((90,000 + 110,000) X $60).
David Eng’s latest frustration is with the CAPlayer. It is reportedly much more expensive to produce than GLASSESong. Following is an analysis of GAME’s cost of production by product.
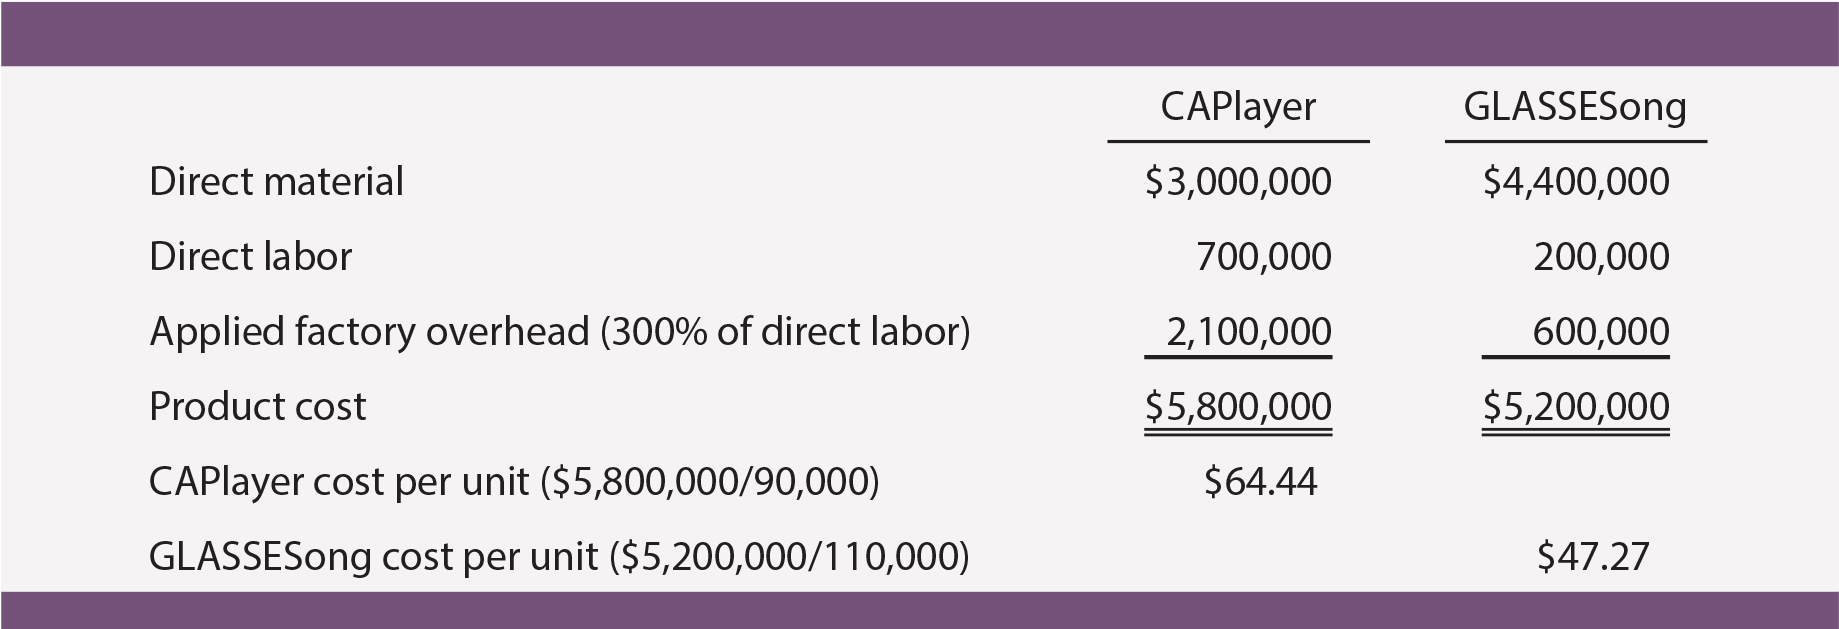
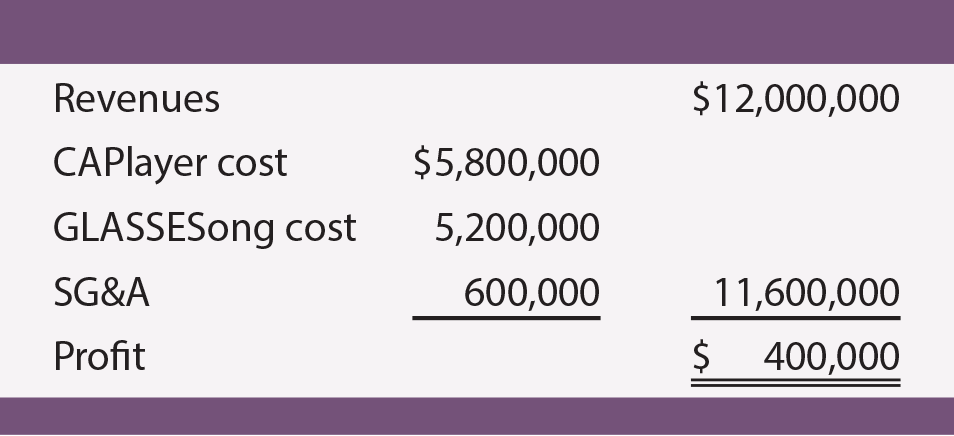
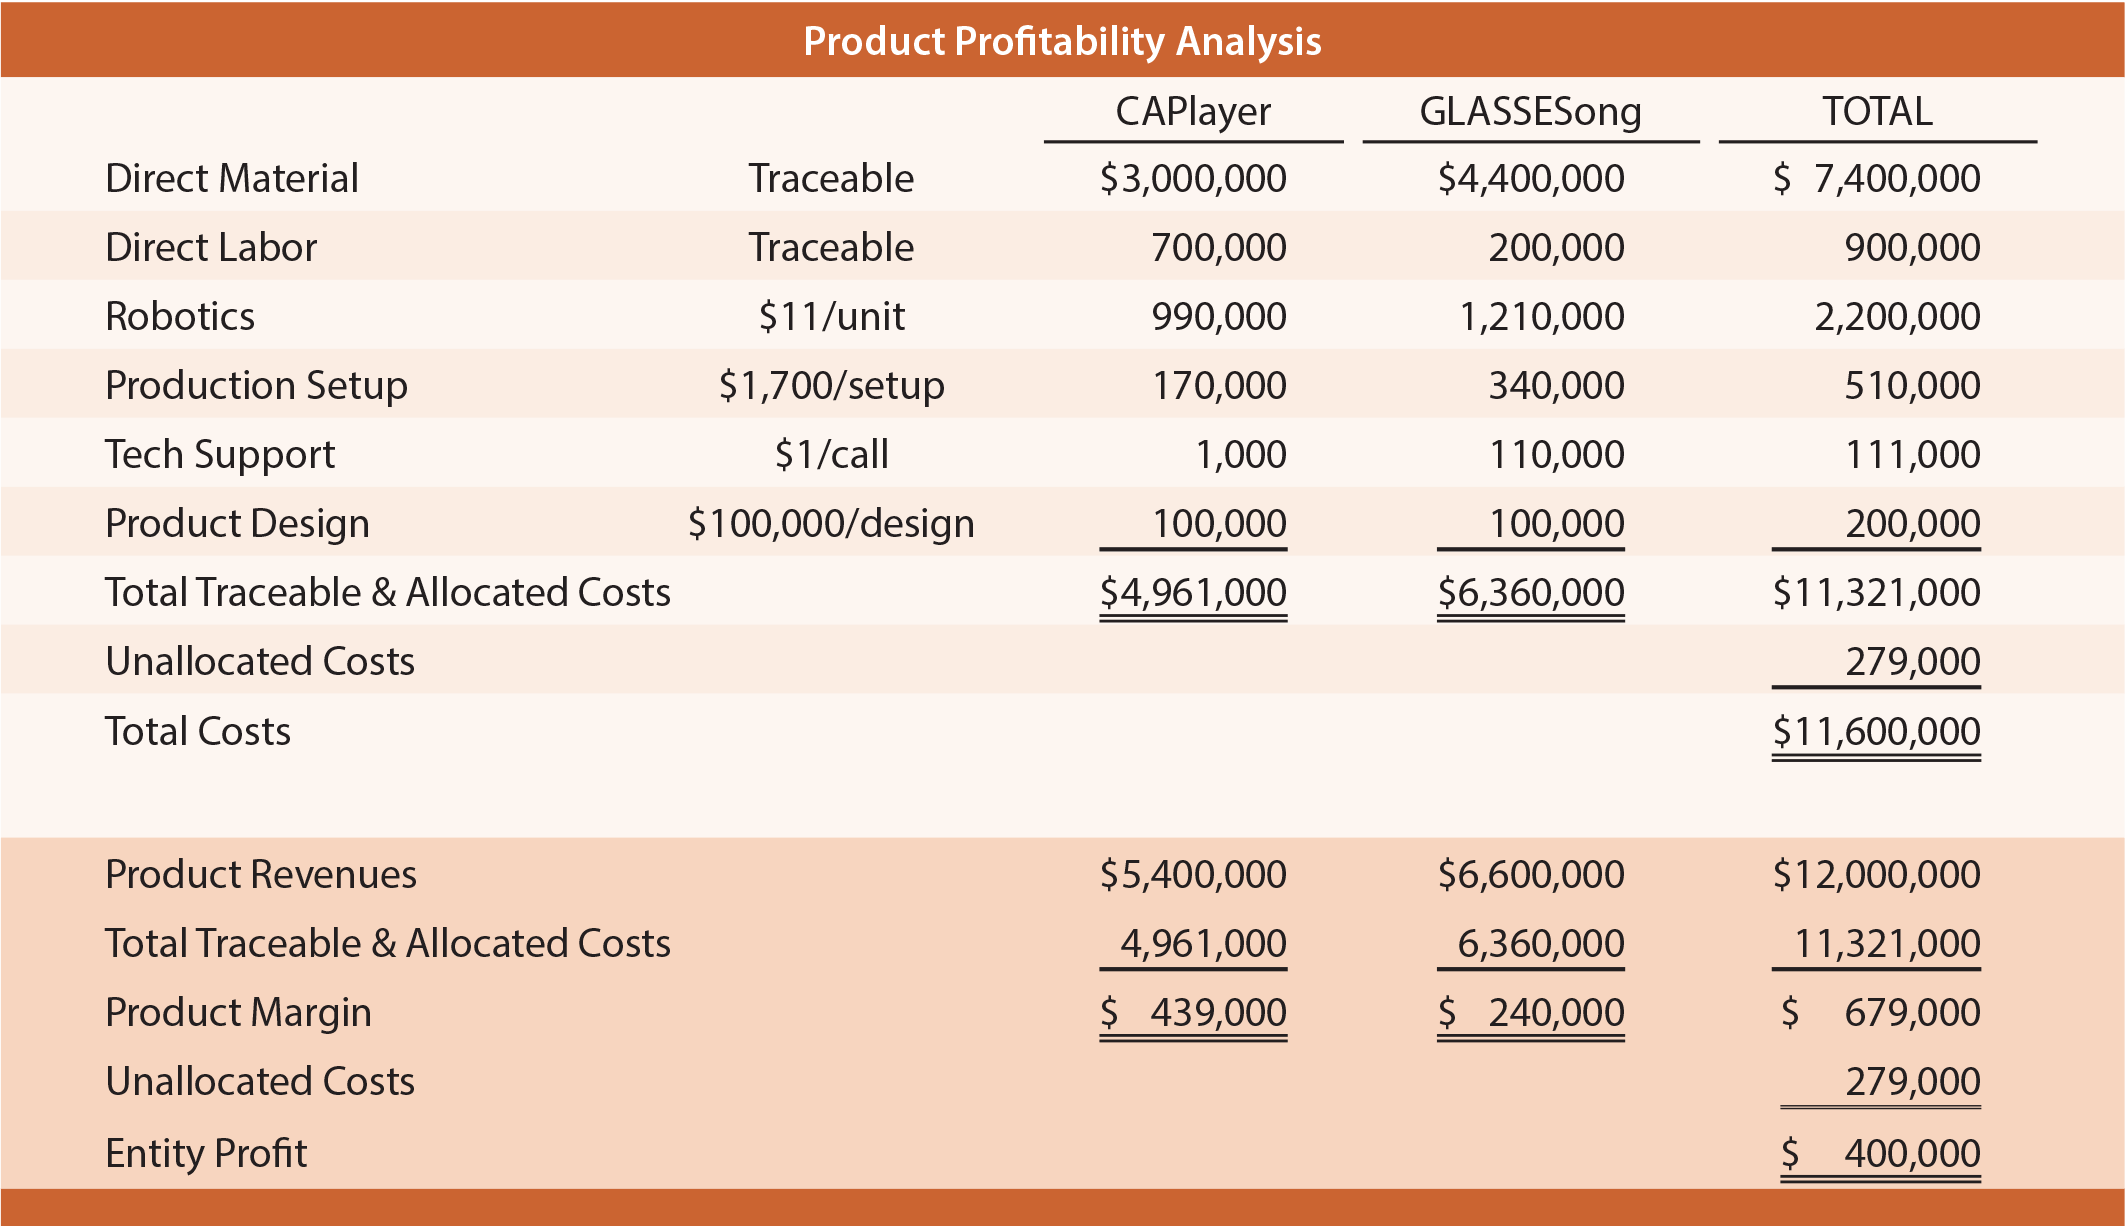
SG&A totaled $600,000. This resulted in a $400,000 profit, as shown. Nevertheless, the per unit data suggest that the CAPlayer is losing money because the sales price is below the $64.44 unit cost. Eng has employed a consultant to review costing techniques. The consultant used ABC and concluded that CAPlayer is more profitable than GLASSESong.
Study Processes And Costs
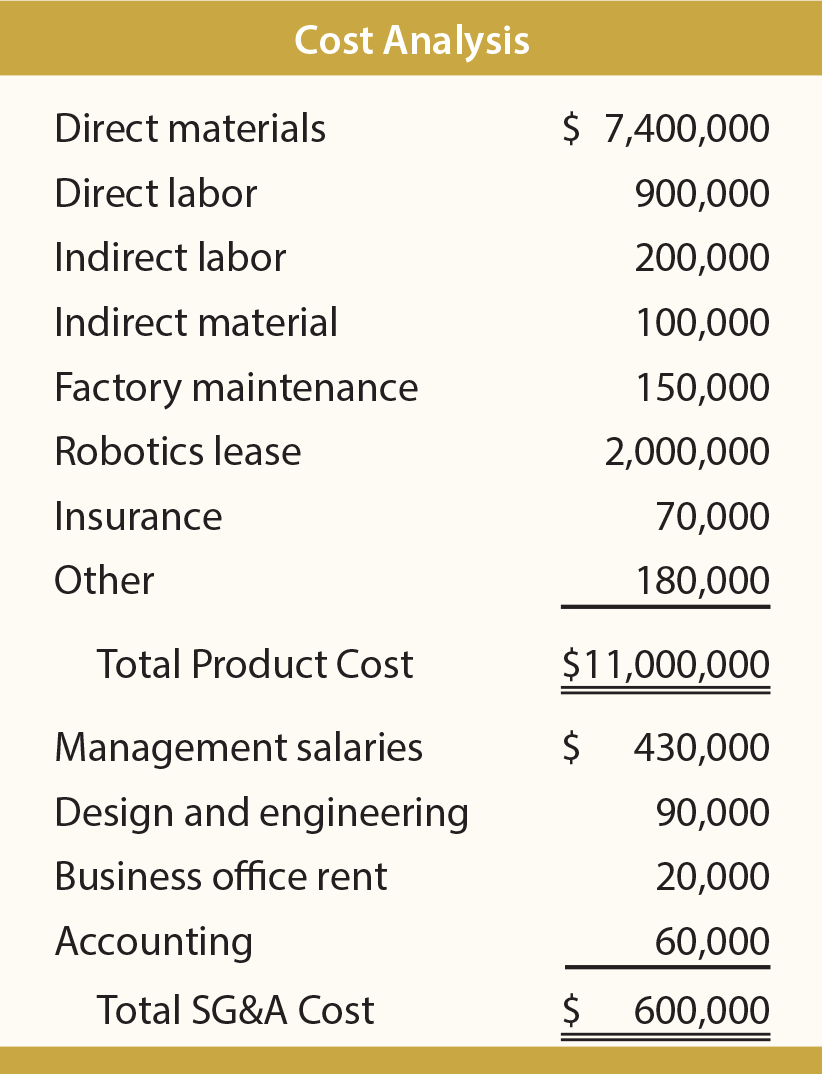 The consultant’s study began with a review of the business, which revealed the following:
- Product costs were $11,000,000 and SG&A $600,000 as shown in the analysis.
- The core components are the same for each device.
- GLASSESong requires added material related to polarized lenses and CAPlayer requires added direct labor for sewing.
- Both devices are produced in batches on the same automated assembly line, at the same pace, and through similar steps.
- Automated machinery is leased from Rebel Robotics, which bases its rental charges on a “units processed” basis.
- There is one production line, and it must be “set up” for each production batch.
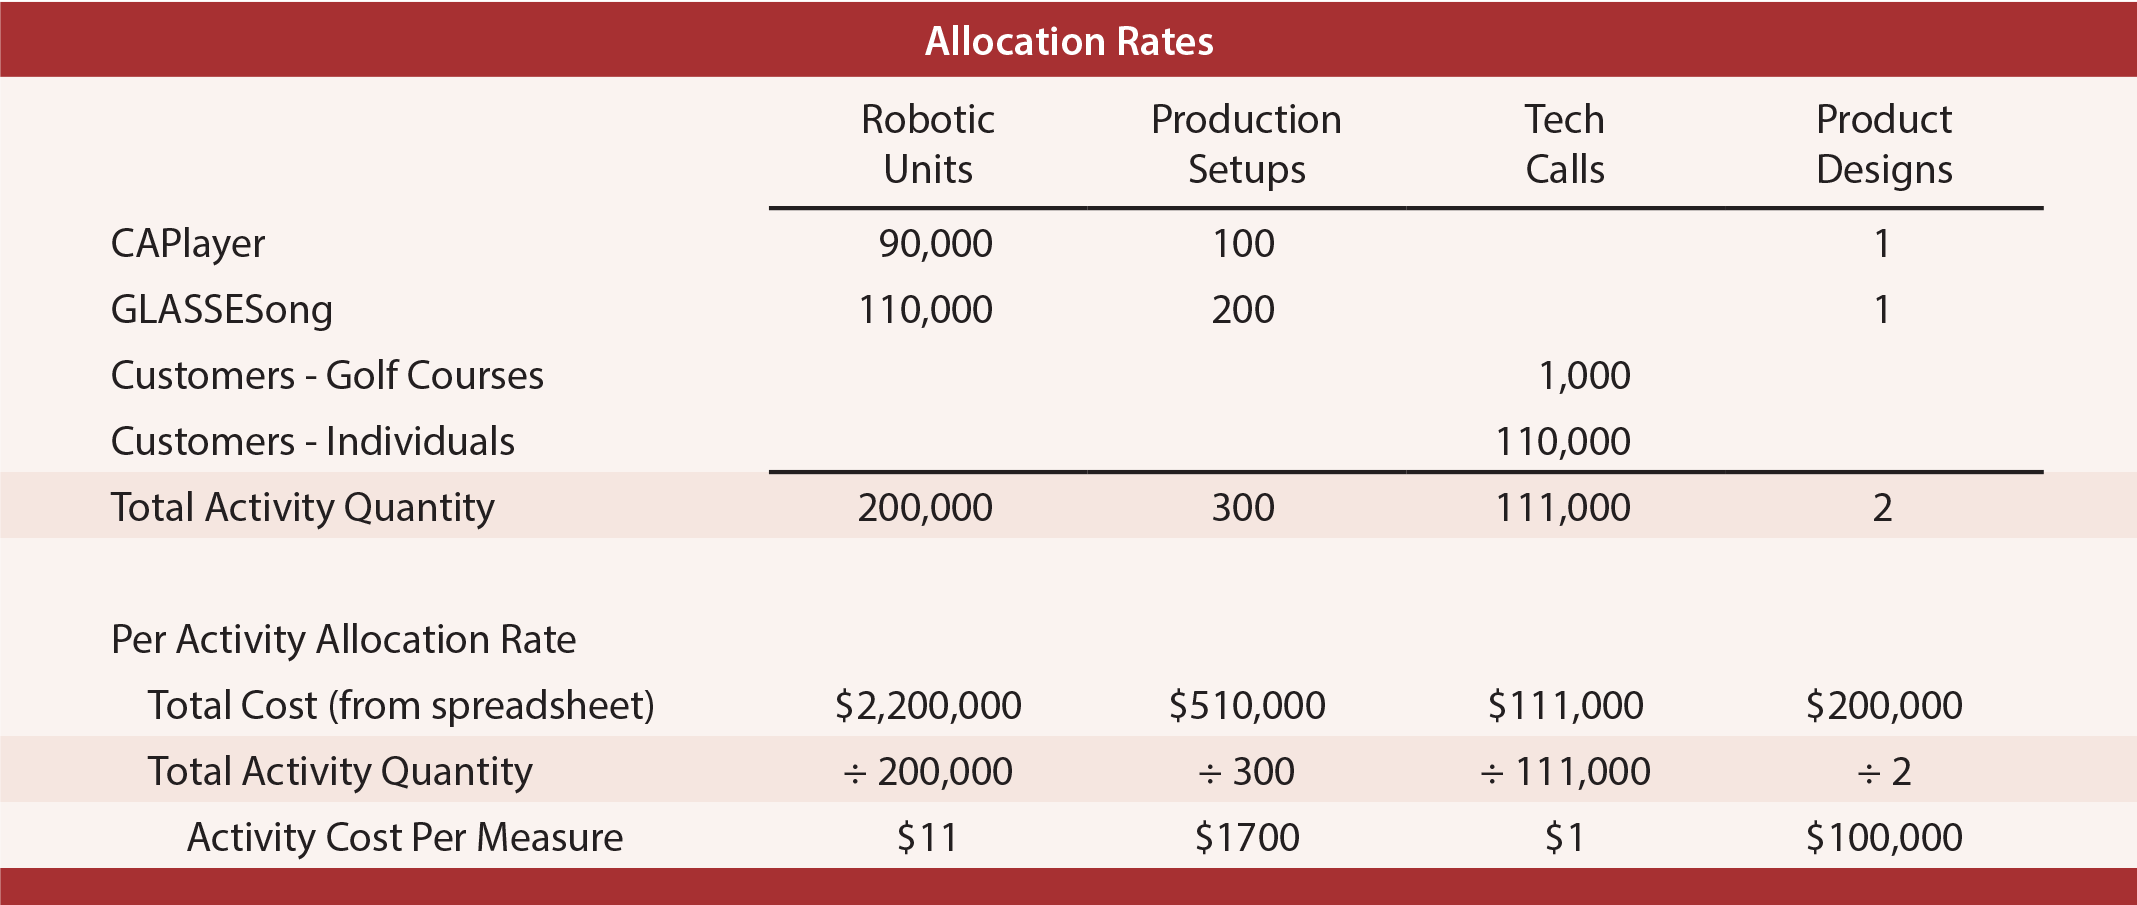
- CAPlayers are produced in batches of 900 and GLASSESongs are produced in batches of 550 units. As a result CAPlayer required 100 setups (90,000 units/900 units per setup) and GLASSESong required 200 setups (110,000 units/550 units per setup).
- Both products were designed by an internal development team.
- A tech support department has been established to help customers download music to their devices. The CAPlayers are sold and supported only through the world’s 1,000 most exclusive golf courses. The golf pros at these courses usually call once to learn the product and require no further assistance. The GLASSESong units are sold over the internet, and individual purchasers average one call per unit sold.
Identify Activities
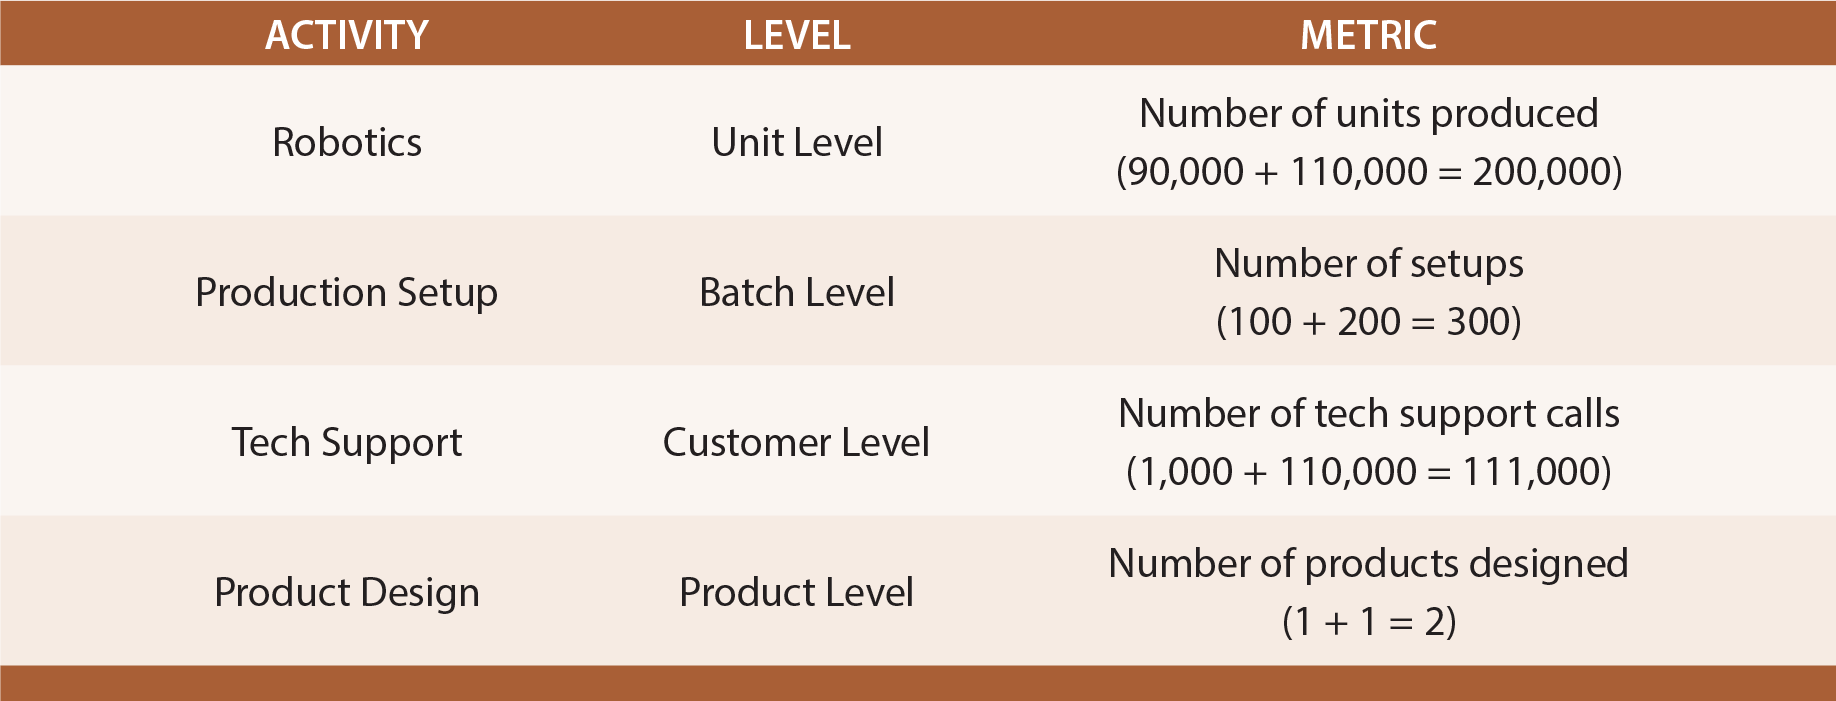
After carefully studying GAME Company, the consultant identified four unique activities. Each of these activities was a significant consumer of resources and generated substantial costs. The robotics function related to the operation of the highly automated assembly line. A large part of the cost of robotics was tied directly to the number of units produced. Production setup was a batch level activity. The company was required to set up the assembly process for each batch of caps and glasses. Tech support was driven by the number of customers. Each purchaser of the glasses was identified as a “customer” and each golf course was identified as a “customer.” The activity driver for product design is the number of products.
Allocate Costs
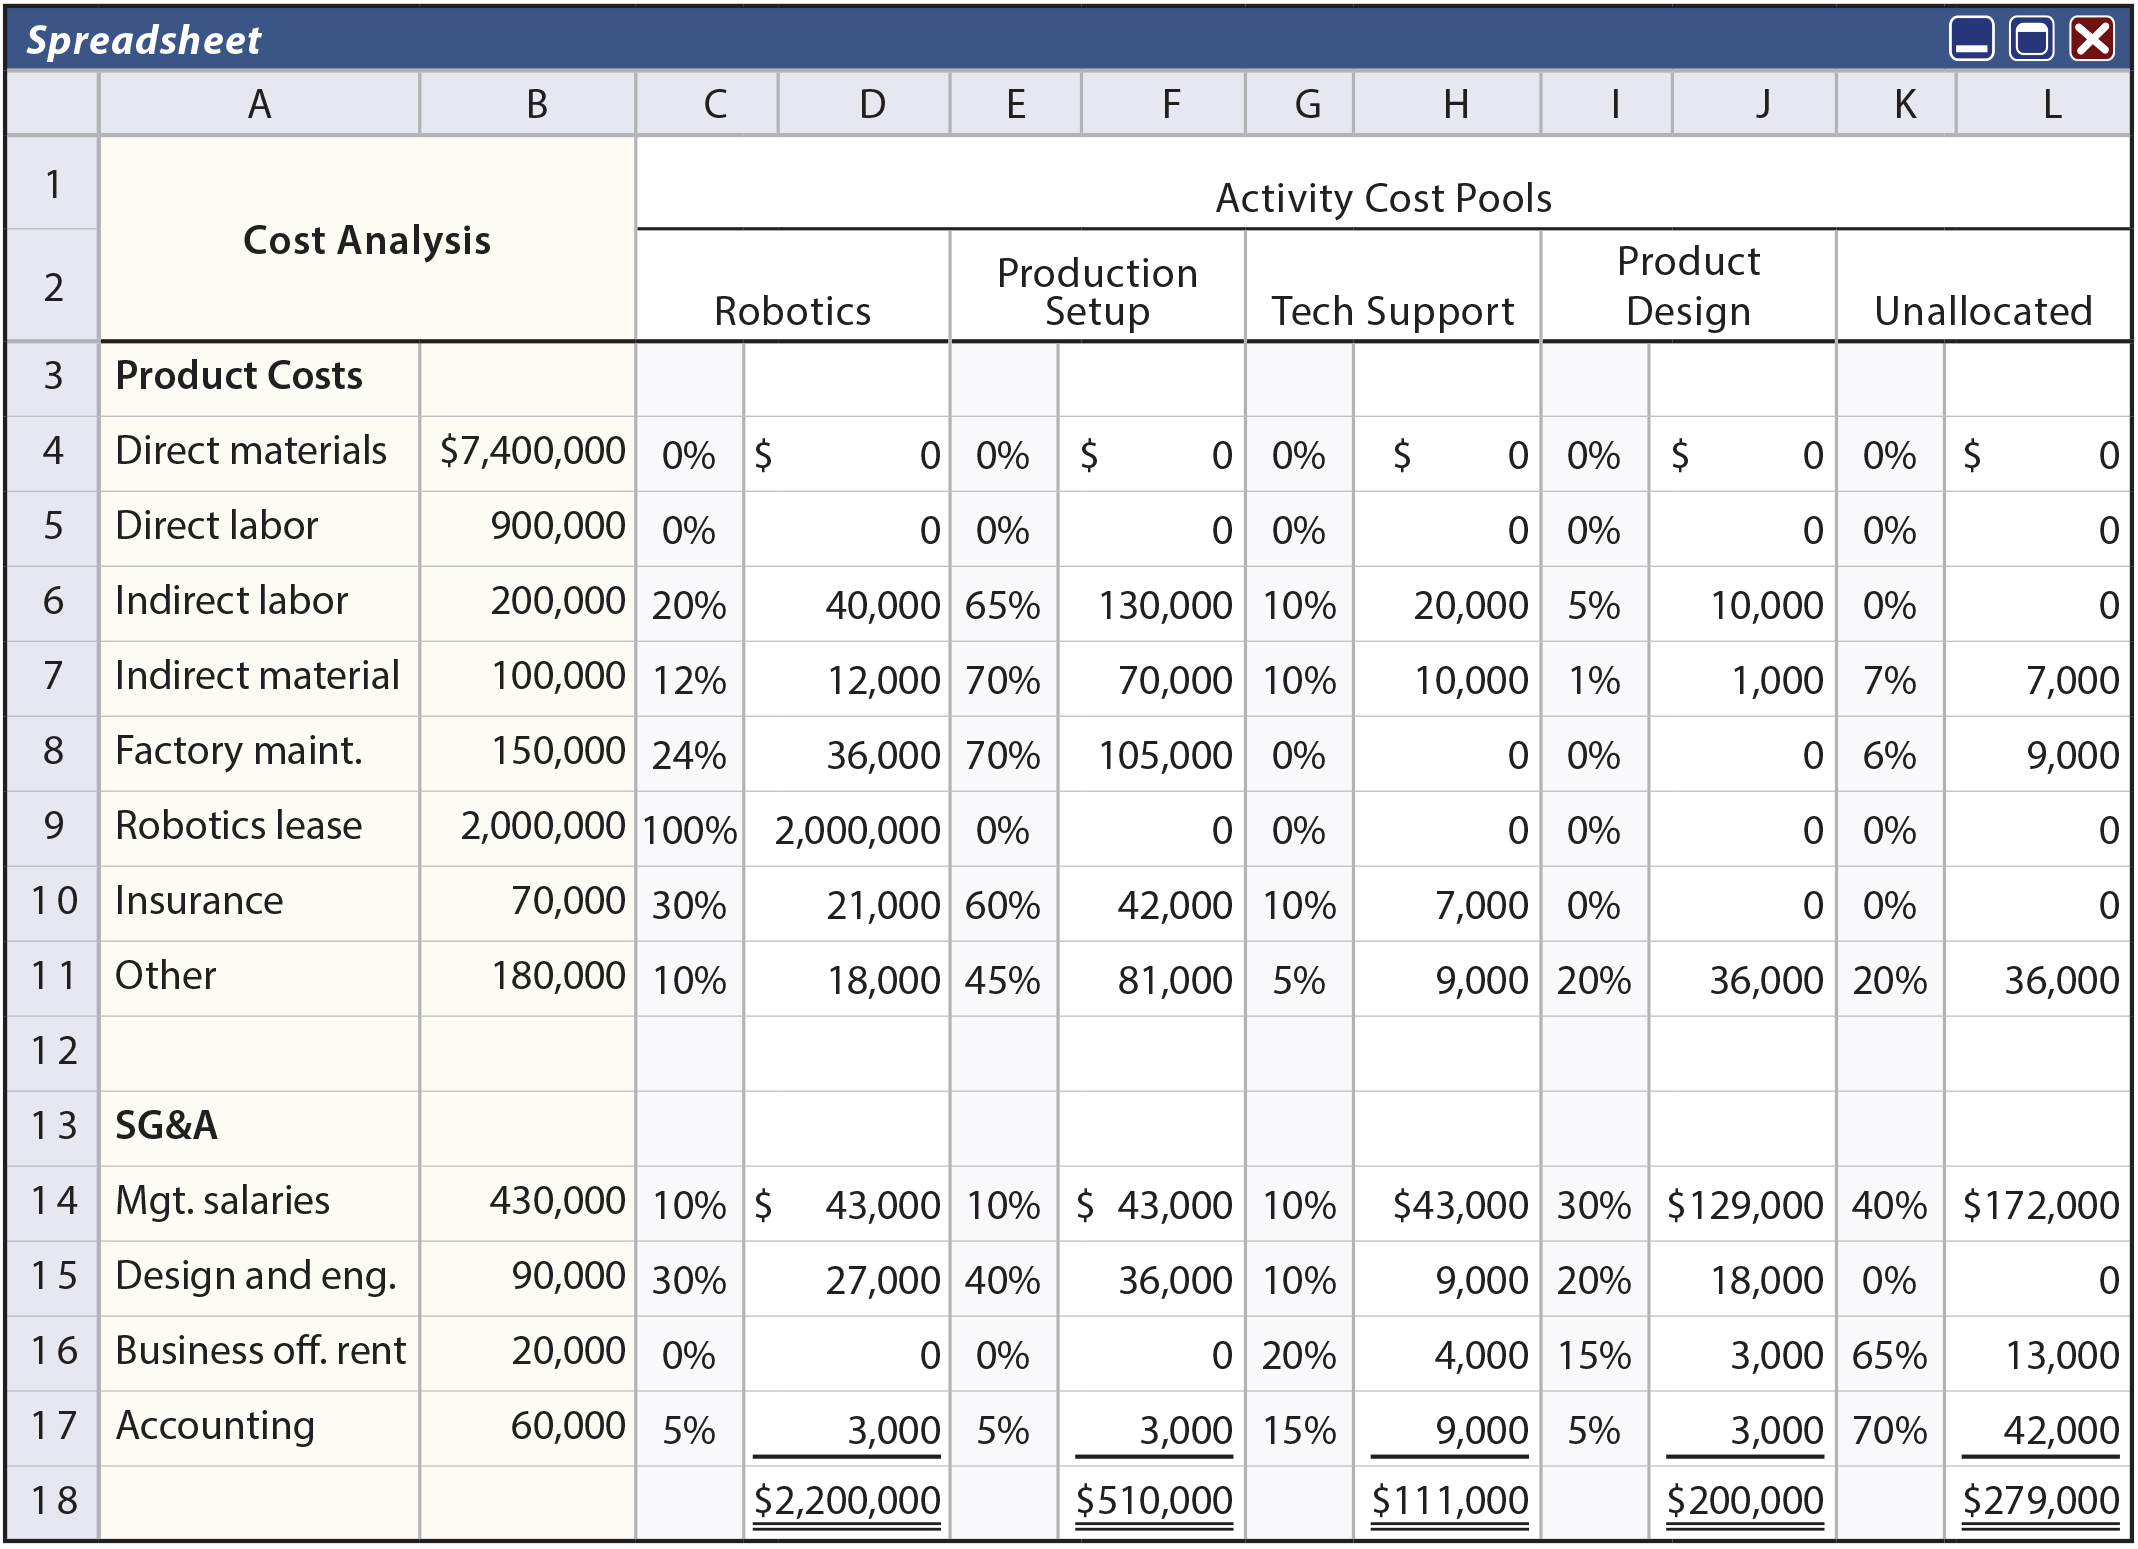
Of the total costs, direct material and direct labor were traceable directly to the product cost object. The other costs were either deemed attributable to one of the four activities, or otherwise not allocated.
The following spreadsheet was prepared based on careful analysis, interviews, and meetings. Columns C, E, G, and I show the percentage of each cost category attributable to each of the four activities. Column K reveals the proportion of each cost that is not allocated. The costs from Column B are multiplied by the percentages to make allocations to each cost pool. For example, 12% of the total indirect material is allocated to robotics ($100,000 from cell B7 X 12% from cell C7 = $12,000 found in cell D7). This process is repeated for each cost and results in the allocations shown.
Determine Per-Activity Rates
The total cost for each activity pool is divided by the activity quantity metric. For example, robotics cost $2,200,000 and 200,000 units were produced. Thus, this activity cost is $11.00 per unit. This calculation is repeated for each activity cost pool, and is summarized in the following schedule.
Apply Costs To Cost Objects
The final step is to analyze results. The top portion of the following analysis applies the per-activity cost information to show how the total cost of CAPlayer is less than the total cost of GLASSESong. The lower portion compares costs and revenues to determine product profitability. Unallocated cost is included in the total column only; it is important, but not tied to either product. Product profitability is portrayed differently under alternative costing methods. Traditional costing applied overhead based on direct labor, which is a small portion of the environment. The point is that skill is required to interpret any costing information.
| Did you learn? |
|---|
| Identify the problem associated with traditional costing methods, and describe how activity-based costing mitigates this concern. |
| Be able to illustrate the fundamental mathematics of activity-based costing versus traditional approaches. |
| Know ABC concepts relating to cost objects, activity drivers, activities, resource drivers, and resources. |
| Describe the different “levels” at which activities can occur and tell why this is important for ABC. |
| Be able to enumerate the steps in setting up an ABC system. |
| Understand how and why ABC can produce different outcomes than traditional costing approaches; know the importance of ABC to management decision making. |
| Know that ABC may not be consistent with GAAP in a particular situation; understanding the fundamental difference in the handling of manufacturing versus nonmanufacturing costs. |


 IDENTIFY TRACEABLE COSTS — Some costs can be traced directly to an end object. One example is the direct material and direct labor that goes into a product. But, there are other examples. The preparation of a product catalog can consume many hours of indirect labor and other internal resources that would be attributable to a related
  DETERMINE PER-ACTIVITY ALLOCATION RATES — Once costs for each activity have been determined, it is then necessary to unitize the cost pool. For example, if the catalog preparation activity cost pool contained $500,000 and 200,000 catalogs were produced, then the allocated catalog cost would be $2.50 each.