CVP analysis is used to build an understanding of the relationship between costs, business volume, and profitability. This analysis will drive decisions about what products to offer and how to price them. CVP is at the heart of techniques used to calculate break-even, volume levels necessary to achieve targeted income levels, and similar computations. The starting point for these calculations is the contribution margin.
The contribution margin is revenues minus variable expenses. Do not confuse the contribution margin with gross profit. Gross profit is calculated after deducting all manufacturing costs associated with sold units, whether fixed or variable.
Instead, the contribution margin reflects the amount available from each sale, after deducting all variable costs associated with the units sold. Some of these variable costs are product costs, and some are selling and administrative in nature. The contribution margin is generally calculated for internal use and is not externally reported.
Margin: Aggregate, Per Unit, or Ratio?
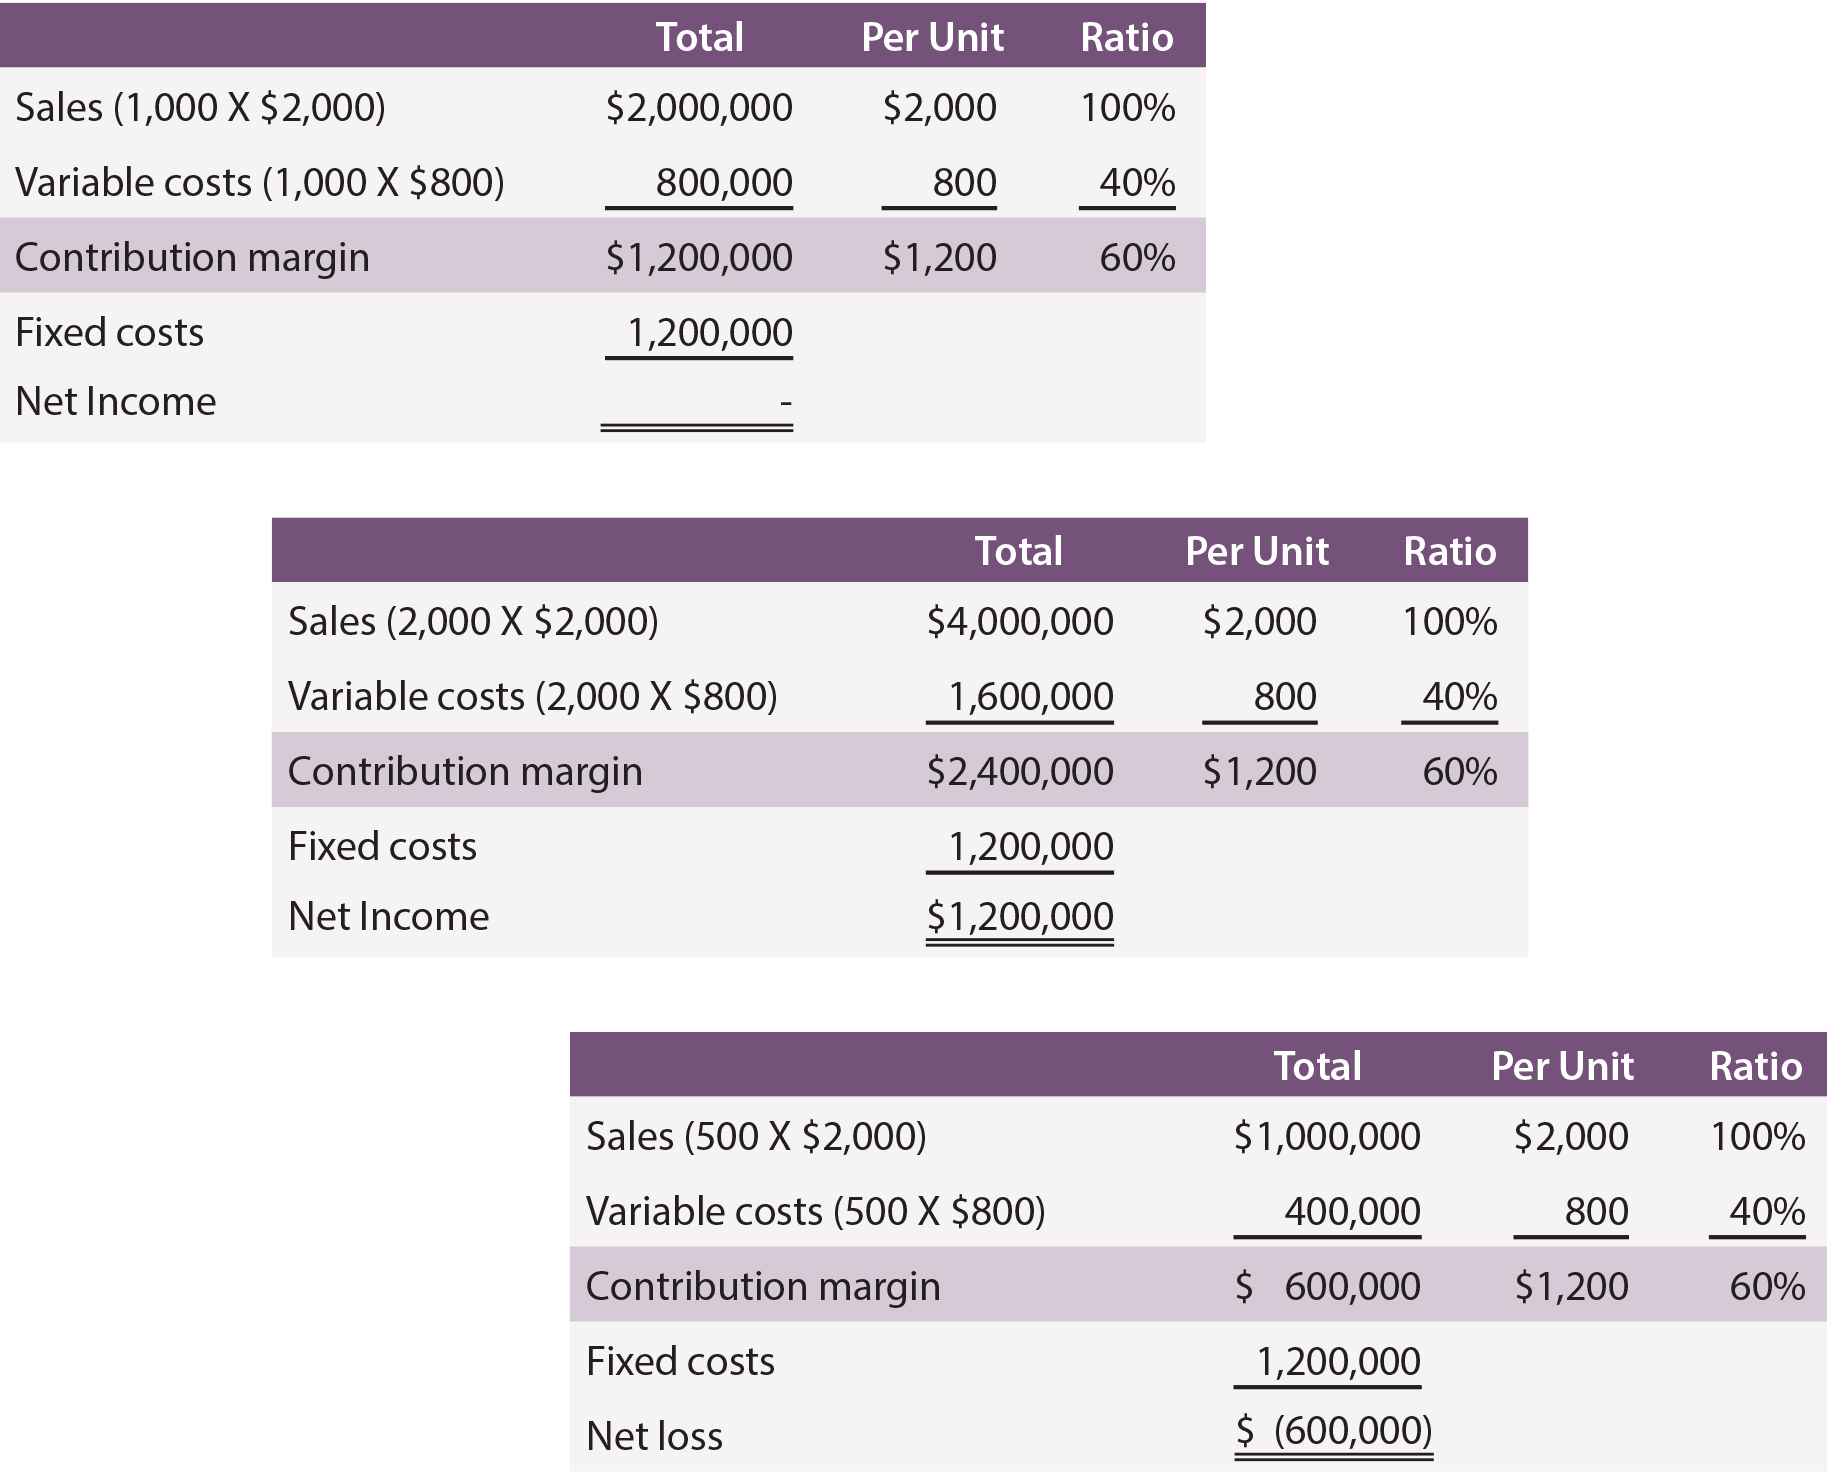
One might refer to contribution margin on an aggregate, per unit, or ratio basis. This point is illustrated for Leyland Sports, a manufacturer of scoreboards. The production cost is $500 per sign, and Leyland pays its sales representatives $300 per sign sold. Thus, variable costs are $800 per sign. Each signs sells for $2,000. Leyland’s contribution margin is $1,200 ($2,000 – ($500 + $300)) per sign. In addition, assume that Leyland incurs $1,200,000 of fixed cost.
Following are schedules with contribution margin information, assuming production and sales of 1,000, 2,000, and 500 units:

Notice that changes in volume only impact certain amounts within the “total column.” Volume changes did not impact fixed costs, nor change the per unit or ratio calculations. By reviewing the data, also note that it is necessary to produce and sell 1,000 units to achieve break-even net income. At 2,000 units, Leyland managed to achieve a $1,200,000 net income. Conversely, if only 500 units are produced and sold, the result will be a $600,000 loss.
Break-Even Chart
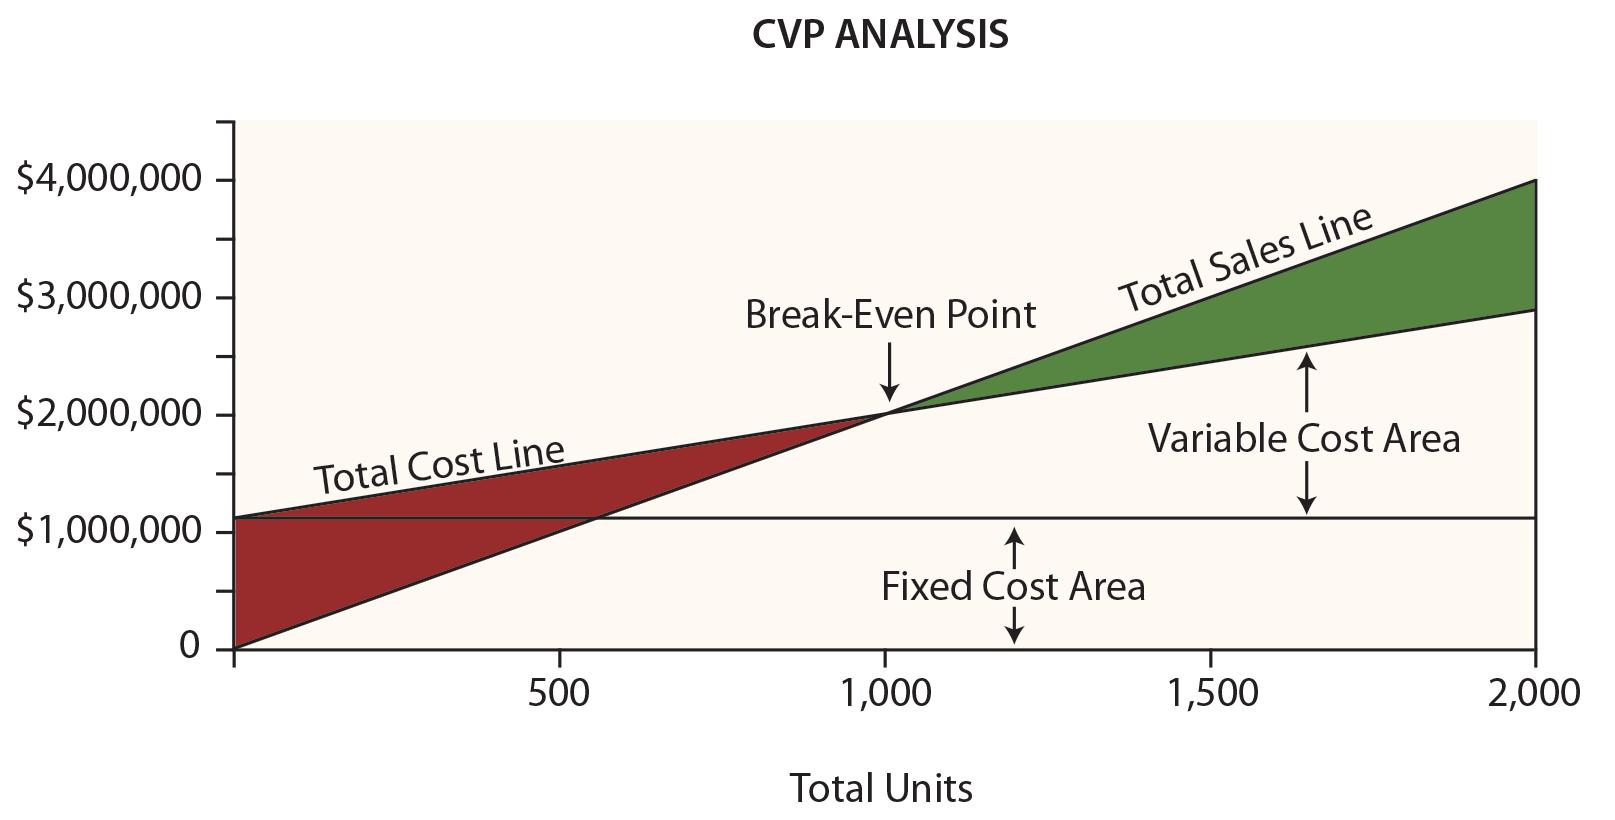
Leyland’s management would probably find the following chart very useful. Dollars are represented on the vertical axis and units on the horizontal.

Be sure to examine this chart, taking note of the following items:
- The total sales line starts at “0” and rises $2,000 for each additional unit.
- The total cost line starts at $1,200,000 (reflecting the fixed cost) and rises $800 for each additional unit (reflecting the addition of variable cost).
- “Break-even” results where sales equal total costs.
- At any given point, the width of the loss area (in red) or profit area (in green) is the difference between sales and total costs.
Break-Even Algebra
Break-even occurs when there is no profit or loss. As noted, the break-even point results where sales and total costs are equal:
Break-Even Sales = Total Variable Costs + Total Fixed Costs
For Leyland, the math works out this way:
(Units X $2,000) = (Units X $800) + $1,200,000
Solving:
Step a: (Units X $2,000) = (Units X $800) + $1,200,000
Step b: (Units X $1,200) = $1,200,000
Step c: Units = 1,000
It is possible to “jump to step b” above by dividing the fixed costs by the contribution margin per unit. Thus, a break-even short cut is:
Break-Even Point in Units = Total Fixed Costs / Contribution Margin Per Unit
1,000 Units = $1,200,000 / $1,200
Sometimes, one may want to know the break-even point in dollars of sales (rather than units). This approach is especially useful for companies with more than one product, where those products all have a similar contribution margin ratio:
Break-Even Point in Sales = Total Fixed Costs / Contribution Margin Ratio
$2,000,000 = $1,200,000 / 0.60
Target Income
Breaking even is not a bad thing, but hardly a satisfactory outcome for most businesses. Instead, a manager may be more interested in learning the necessary sales level to achieve a targeted profit. The approach to solving this problem is to treat the target income like an added increment of fixed costs. In other words, the margin must cover the fixed costs and the desired profit. Assume Leyland wants to know the level of sales to reach a $600,000 target income:
Solving:
Step a: (Units X $2,000) = (Units X $800) + $1,200,000 + $600,000
Step b: (Units X $1,200) = $1,800,000
Step c: Units = 1,500
Again, it is possible to “jump to step b” by dividing the fixed costs and target income by the per unit contribution margin:
Units to Achieve a Target Income = (Total Fixed Costs + Target Income) / Contribution Margin Per Unit
1,500 Units = $1,800,000 / $1,200
If one wants to know the dollar level of sales to achieve a target net income:
Sales to Achieve a Target Income = (Total Fixed Costs + Target Income) / Contribution Margin Ratio
$3,000,000 = $1,800,000 / 0.60
Critical Thinking About CVP
CVP is more than just a mathematical tool to calculate values like the break-even point. It can be used for critical evaluations about business viability.
For instance, a manager should be aware of the “margin of safety.” The margin of safety is the degree to which sales exceed the break-even point. For Leyland, the degree to which sales exceed $2,000,000 (its break-even point) is the margin of safety. This will give a manager valuable information as he or she plans for inevitable business cycles.
A manager should also understand the scalability of the business. This refers to the ability to grow profits with increases in volume. Compare the income analysis for Leaping Lemming Corporation and Leaping Leopard Corporation:

Both companies “broke even” in 20X1. Which company would one rather own? If one knew that each company was growing rapidly and expected to double sales each year (without any change in cost structure), which company would be preferred? With the added information, one would expect the following 20X2 outcomes:

This analysis reveals that Leopard has a more scalable business model. Its contribution margin is high and once it clears its fixed cost hurdle, it will turn very profitable. Lemming is fighting a never-ending battle; sales increases are met with significant increases in variable costs. Be aware that scalability can be a double-edged sword. Pull backs in volume can be devastating to companies like Leopard because the fixed cost burden can be consuming. Whatever the situation, managers need to be fully cognizant of the effects of changes in scale on the bottom-line performance.
| Did you learn? |
|---|
| Define cost-volume-profit analysis. |
| Be able to prepare a “break-even graph.” |
| Define the contribution margin; distinguishing between aggregate, per unit, and ratio amounts. |
| Understand the break-even point and target income. |
| Be able to perform break-even and target income computations. |
| What are some of the applications for CVP analysis? |
